Immigrants from Germany vs Immigrants from Scotland In Labor Force | Age 20-24
COMPARE
Immigrants from Germany
Immigrants from Scotland
In Labor Force | Age 20-24
In Labor Force | Age 20-24 Comparison
Immigrants from Germany
Immigrants from Scotland
76.2%
IN LABOR FORCE | AGE 20-24
98.5/ 100
METRIC RATING
95th/ 347
METRIC RANK
75.8%
IN LABOR FORCE | AGE 20-24
93.7/ 100
METRIC RATING
125th/ 347
METRIC RANK
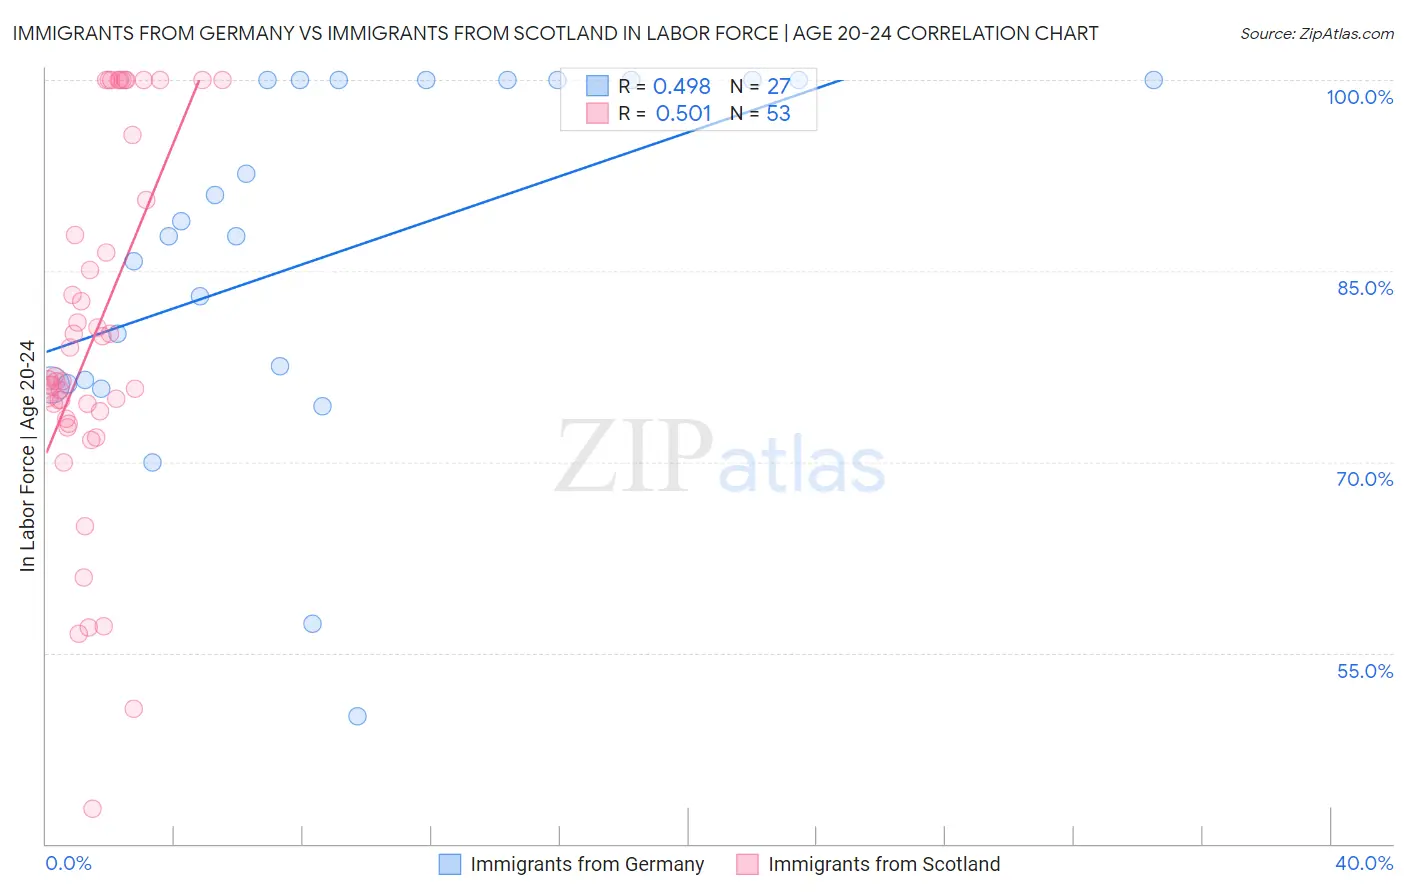
Immigrants from Germany vs Immigrants from Scotland In Labor Force | Age 20-24 Correlation Chart
The statistical analysis conducted on geographies consisting of 463,533,705 people shows a moderate positive correlation between the proportion of Immigrants from Germany and labor force participation rate among population between the ages 20 and 24 in the United States with a correlation coefficient (R) of 0.498 and weighted average of 76.2%. Similarly, the statistical analysis conducted on geographies consisting of 196,345,554 people shows a substantial positive correlation between the proportion of Immigrants from Scotland and labor force participation rate among population between the ages 20 and 24 in the United States with a correlation coefficient (R) of 0.501 and weighted average of 75.8%, a difference of 0.55%.
In Labor Force | Age 20-24 Correlation Summary
| Measurement | Immigrants from Germany | Immigrants from Scotland |
| Minimum | 50.0% | 42.7% |
| Maximum | 100.0% | 100.0% |
| Range | 50.0% | 57.3% |
| Mean | 86.3% | 80.1% |
| Median | 87.8% | 76.4% |
| Interquartile 25% (IQ1) | 76.1% | 73.7% |
| Interquartile 75% (IQ3) | 100.0% | 93.2% |
| Interquartile Range (IQR) | 23.9% | 19.5% |
| Standard Deviation (Sample) | 14.0% | 14.2% |
| Standard Deviation (Population) | 13.7% | 14.0% |
Similar Demographics by In Labor Force | Age 20-24
Demographics Similar to Immigrants from Germany by In Labor Force | Age 20-24
In terms of in labor force | age 20-24, the demographic groups most similar to Immigrants from Germany are Potawatomi (76.2%, a difference of 0.0%), Nonimmigrants (76.2%, a difference of 0.010%), Hungarian (76.3%, a difference of 0.10%), Immigrants from Lithuania (76.1%, a difference of 0.11%), and Immigrants from Oceania (76.1%, a difference of 0.11%).
| Demographics | Rating | Rank | In Labor Force | Age 20-24 |
| Spanish | 99.2 /100 | #88 | Exceptional 76.4% |
| Bulgarians | 99.2 /100 | #89 | Exceptional 76.4% |
| Immigrants | Burma/Myanmar | 99.1 /100 | #90 | Exceptional 76.3% |
| Sierra Leoneans | 99.0 /100 | #91 | Exceptional 76.3% |
| Maltese | 98.9 /100 | #92 | Exceptional 76.3% |
| Hungarians | 98.9 /100 | #93 | Exceptional 76.3% |
| Potawatomi | 98.5 /100 | #94 | Exceptional 76.2% |
| Immigrants | Germany | 98.5 /100 | #95 | Exceptional 76.2% |
| Immigrants | Nonimmigrants | 98.5 /100 | #96 | Exceptional 76.2% |
| Immigrants | Lithuania | 98.0 /100 | #97 | Exceptional 76.1% |
| Immigrants | Oceania | 98.0 /100 | #98 | Exceptional 76.1% |
| Americans | 97.8 /100 | #99 | Exceptional 76.1% |
| Shoshone | 97.8 /100 | #100 | Exceptional 76.1% |
| Immigrants | Poland | 97.7 /100 | #101 | Exceptional 76.1% |
| Latvians | 97.6 /100 | #102 | Exceptional 76.1% |
Demographics Similar to Immigrants from Scotland by In Labor Force | Age 20-24
In terms of in labor force | age 20-24, the demographic groups most similar to Immigrants from Scotland are Immigrants from Sierra Leone (75.8%, a difference of 0.010%), Pakistani (75.8%, a difference of 0.030%), Immigrants from Bulgaria (75.8%, a difference of 0.030%), Immigrants from Serbia (75.8%, a difference of 0.040%), and Brazilian (75.8%, a difference of 0.040%).
| Demographics | Rating | Rank | In Labor Force | Age 20-24 |
| Spanish Americans | 94.8 /100 | #118 | Exceptional 75.8% |
| Immigrants | Portugal | 94.8 /100 | #119 | Exceptional 75.8% |
| Immigrants | Africa | 94.6 /100 | #120 | Exceptional 75.8% |
| Immigrants | Serbia | 94.3 /100 | #121 | Exceptional 75.8% |
| Pakistanis | 94.1 /100 | #122 | Exceptional 75.8% |
| Immigrants | Bulgaria | 94.1 /100 | #123 | Exceptional 75.8% |
| Immigrants | Sierra Leone | 93.8 /100 | #124 | Exceptional 75.8% |
| Immigrants | Scotland | 93.7 /100 | #125 | Exceptional 75.8% |
| Brazilians | 93.0 /100 | #126 | Exceptional 75.8% |
| Sub-Saharan Africans | 90.9 /100 | #127 | Exceptional 75.7% |
| Immigrants | Afghanistan | 89.4 /100 | #128 | Excellent 75.6% |
| Iroquois | 89.1 /100 | #129 | Excellent 75.6% |
| Immigrants | Austria | 88.8 /100 | #130 | Excellent 75.6% |
| Immigrants | Jordan | 88.5 /100 | #131 | Excellent 75.6% |
| Palestinians | 88.4 /100 | #132 | Excellent 75.6% |