Bermudan vs Soviet Union In Labor Force | Age 20-24
COMPARE
Bermudan
Soviet Union
In Labor Force | Age 20-24
In Labor Force | Age 20-24 Comparison
Bermudans
Soviet Union
74.1%
IN LABOR FORCE | AGE 20-24
3.2/ 100
METRIC RATING
237th/ 347
METRIC RANK
72.3%
IN LABOR FORCE | AGE 20-24
0.0/ 100
METRIC RATING
308th/ 347
METRIC RANK
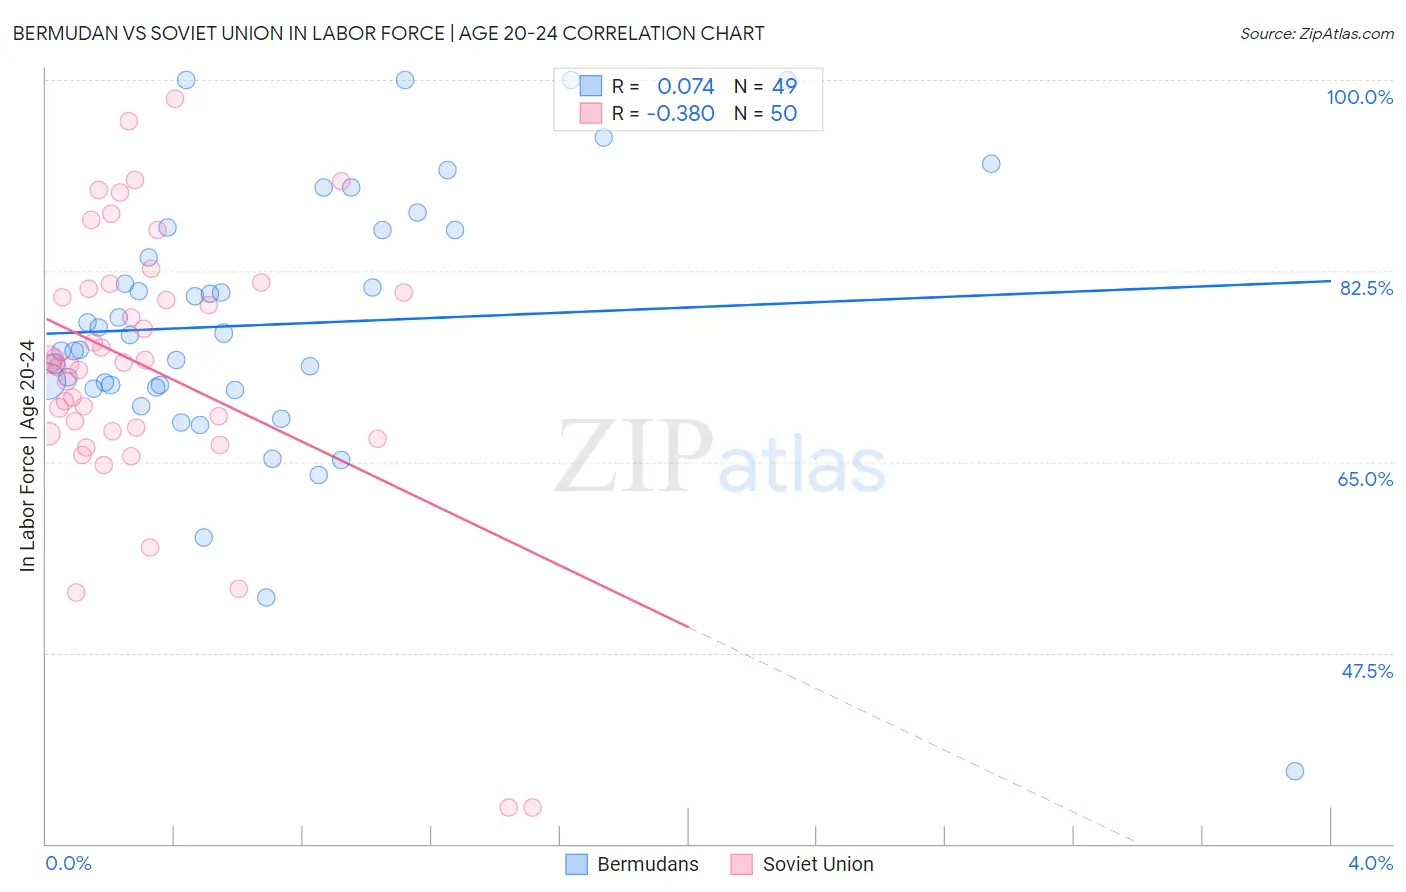
Bermudan vs Soviet Union In Labor Force | Age 20-24 Correlation Chart
The statistical analysis conducted on geographies consisting of 55,728,431 people shows a slight positive correlation between the proportion of Bermudans and labor force participation rate among population between the ages 20 and 24 in the United States with a correlation coefficient (R) of 0.074 and weighted average of 74.1%. Similarly, the statistical analysis conducted on geographies consisting of 43,512,203 people shows a mild negative correlation between the proportion of Soviet Union and labor force participation rate among population between the ages 20 and 24 in the United States with a correlation coefficient (R) of -0.380 and weighted average of 72.3%, a difference of 2.6%.
In Labor Force | Age 20-24 Correlation Summary
| Measurement | Bermudan | Soviet Union |
| Minimum | 36.7% | 33.3% |
| Maximum | 100.0% | 98.3% |
| Range | 63.3% | 65.0% |
| Mean | 77.6% | 73.7% |
| Median | 76.7% | 74.1% |
| Interquartile 25% (IQ1) | 71.8% | 67.8% |
| Interquartile 75% (IQ3) | 86.2% | 80.9% |
| Interquartile Range (IQR) | 14.4% | 13.0% |
| Standard Deviation (Sample) | 12.3% | 12.9% |
| Standard Deviation (Population) | 12.1% | 12.7% |
Similar Demographics by In Labor Force | Age 20-24
Demographics Similar to Bermudans by In Labor Force | Age 20-24
In terms of in labor force | age 20-24, the demographic groups most similar to Bermudans are Immigrants from France (74.1%, a difference of 0.010%), Laotian (74.1%, a difference of 0.030%), Immigrants from Japan (74.1%, a difference of 0.030%), Immigrants (74.1%, a difference of 0.040%), and Immigrants from Chile (74.1%, a difference of 0.050%).
| Demographics | Rating | Rank | In Labor Force | Age 20-24 |
| Immigrants | Albania | 4.3 /100 | #230 | Tragic 74.2% |
| Immigrants | Greece | 4.1 /100 | #231 | Tragic 74.2% |
| Immigrants | Switzerland | 4.1 /100 | #232 | Tragic 74.2% |
| Immigrants | Chile | 3.7 /100 | #233 | Tragic 74.1% |
| Immigrants | Immigrants | 3.6 /100 | #234 | Tragic 74.1% |
| Laotians | 3.5 /100 | #235 | Tragic 74.1% |
| Immigrants | France | 3.3 /100 | #236 | Tragic 74.1% |
| Bermudans | 3.2 /100 | #237 | Tragic 74.1% |
| Immigrants | Japan | 3.0 /100 | #238 | Tragic 74.1% |
| Immigrants | Latin America | 2.7 /100 | #239 | Tragic 74.1% |
| Immigrants | Sri Lanka | 2.3 /100 | #240 | Tragic 74.0% |
| Immigrants | Senegal | 2.1 /100 | #241 | Tragic 74.0% |
| Thais | 2.1 /100 | #242 | Tragic 74.0% |
| Immigrants | Syria | 1.9 /100 | #243 | Tragic 74.0% |
| Immigrants | South Central Asia | 1.9 /100 | #244 | Tragic 74.0% |
Demographics Similar to Soviet Union by In Labor Force | Age 20-24
In terms of in labor force | age 20-24, the demographic groups most similar to Soviet Union are Tsimshian (72.3%, a difference of 0.0%), Immigrants from Ecuador (72.3%, a difference of 0.010%), Immigrants from Jamaica (72.4%, a difference of 0.16%), Immigrants from Singapore (72.4%, a difference of 0.18%), and Immigrants from West Indies (72.4%, a difference of 0.21%).
| Demographics | Rating | Rank | In Labor Force | Age 20-24 |
| Cubans | 0.0 /100 | #301 | Tragic 72.5% |
| Natives/Alaskans | 0.0 /100 | #302 | Tragic 72.4% |
| Ecuadorians | 0.0 /100 | #303 | Tragic 72.4% |
| Immigrants | West Indies | 0.0 /100 | #304 | Tragic 72.4% |
| Immigrants | Singapore | 0.0 /100 | #305 | Tragic 72.4% |
| Immigrants | Jamaica | 0.0 /100 | #306 | Tragic 72.4% |
| Immigrants | Ecuador | 0.0 /100 | #307 | Tragic 72.3% |
| Soviet Union | 0.0 /100 | #308 | Tragic 72.3% |
| Tsimshian | 0.0 /100 | #309 | Tragic 72.3% |
| Immigrants | Cuba | 0.0 /100 | #310 | Tragic 72.0% |
| Apache | 0.0 /100 | #311 | Tragic 72.0% |
| Immigrants | Caribbean | 0.0 /100 | #312 | Tragic 71.9% |
| Immigrants | Dominica | 0.0 /100 | #313 | Tragic 71.9% |
| Indians (Asian) | 0.0 /100 | #314 | Tragic 71.9% |
| Immigrants | Iran | 0.0 /100 | #315 | Tragic 71.8% |