Ukrainian vs Soviet Union In Labor Force | Age 20-24
COMPARE
Ukrainian
Soviet Union
In Labor Force | Age 20-24
In Labor Force | Age 20-24 Comparison
Ukrainians
Soviet Union
75.9%
IN LABOR FORCE | AGE 20-24
95.7/ 100
METRIC RATING
111th/ 347
METRIC RANK
72.3%
IN LABOR FORCE | AGE 20-24
0.0/ 100
METRIC RATING
308th/ 347
METRIC RANK
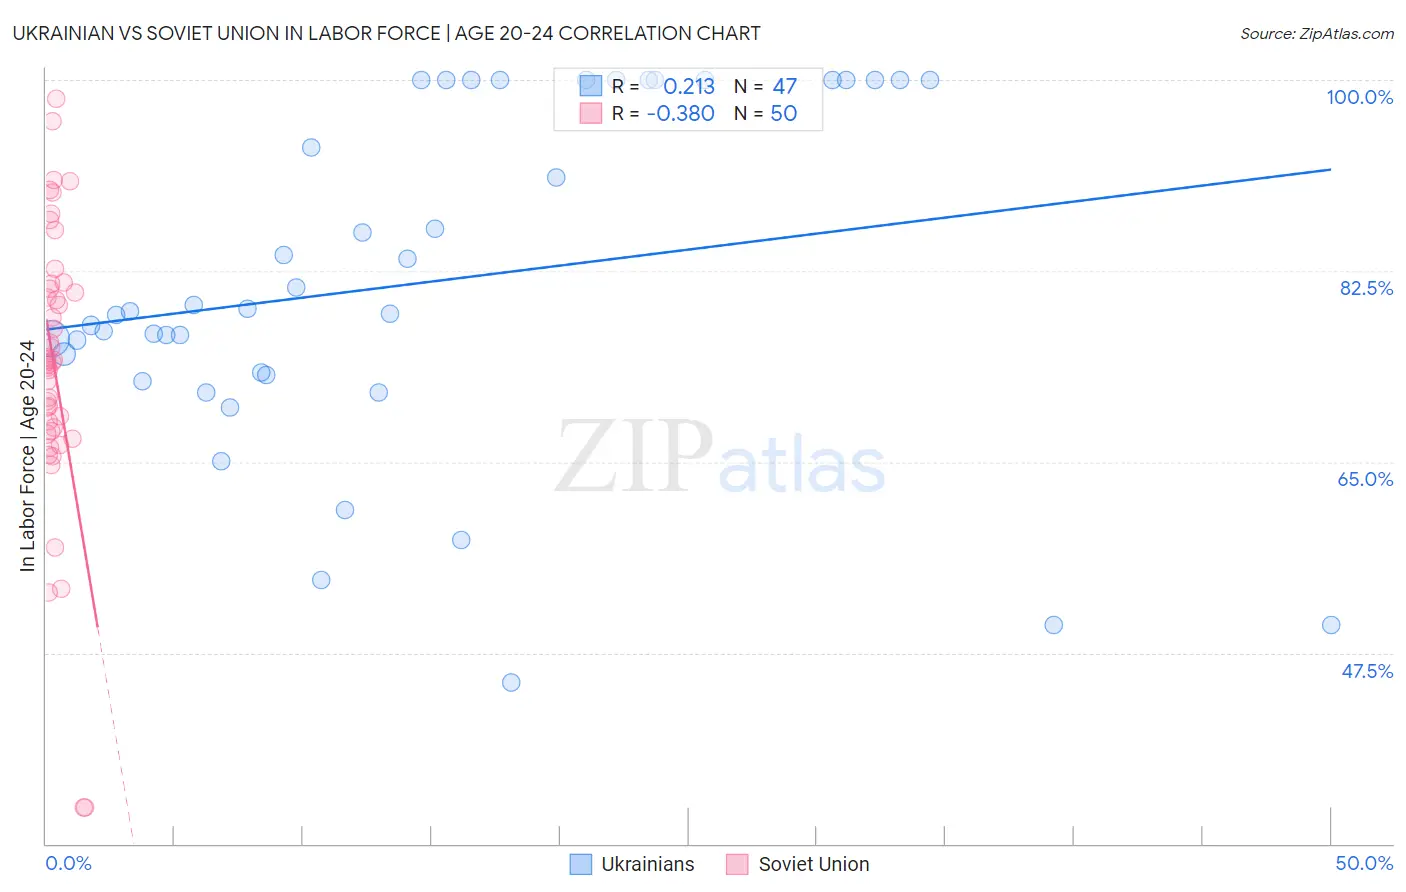
Ukrainian vs Soviet Union In Labor Force | Age 20-24 Correlation Chart
The statistical analysis conducted on geographies consisting of 448,349,604 people shows a weak positive correlation between the proportion of Ukrainians and labor force participation rate among population between the ages 20 and 24 in the United States with a correlation coefficient (R) of 0.213 and weighted average of 75.9%. Similarly, the statistical analysis conducted on geographies consisting of 43,512,203 people shows a mild negative correlation between the proportion of Soviet Union and labor force participation rate among population between the ages 20 and 24 in the United States with a correlation coefficient (R) of -0.380 and weighted average of 72.3%, a difference of 5.0%.
In Labor Force | Age 20-24 Correlation Summary
| Measurement | Ukrainian | Soviet Union |
| Minimum | 44.8% | 33.3% |
| Maximum | 100.0% | 98.3% |
| Range | 55.2% | 65.0% |
| Mean | 81.4% | 73.7% |
| Median | 78.8% | 74.1% |
| Interquartile 25% (IQ1) | 73.0% | 67.8% |
| Interquartile 75% (IQ3) | 100.0% | 80.9% |
| Interquartile Range (IQR) | 27.0% | 13.0% |
| Standard Deviation (Sample) | 15.6% | 12.9% |
| Standard Deviation (Population) | 15.5% | 12.7% |
Similar Demographics by In Labor Force | Age 20-24
Demographics Similar to Ukrainians by In Labor Force | Age 20-24
In terms of in labor force | age 20-24, the demographic groups most similar to Ukrainians are Cherokee (75.9%, a difference of 0.010%), Immigrants from Morocco (75.9%, a difference of 0.010%), Immigrants from Canada (75.9%, a difference of 0.010%), Immigrants from Netherlands (75.9%, a difference of 0.040%), and Immigrants from Zimbabwe (75.9%, a difference of 0.050%).
| Demographics | Rating | Rank | In Labor Force | Age 20-24 |
| Macedonians | 97.2 /100 | #104 | Exceptional 76.0% |
| Immigrants | Nepal | 97.2 /100 | #105 | Exceptional 76.0% |
| Immigrants | Uganda | 97.1 /100 | #106 | Exceptional 76.0% |
| Greeks | 96.9 /100 | #107 | Exceptional 76.0% |
| Iraqis | 96.6 /100 | #108 | Exceptional 76.0% |
| Cherokee | 95.8 /100 | #109 | Exceptional 75.9% |
| Immigrants | Morocco | 95.8 /100 | #110 | Exceptional 75.9% |
| Ukrainians | 95.7 /100 | #111 | Exceptional 75.9% |
| Immigrants | Canada | 95.6 /100 | #112 | Exceptional 75.9% |
| Immigrants | Netherlands | 95.3 /100 | #113 | Exceptional 75.9% |
| Immigrants | Zimbabwe | 95.1 /100 | #114 | Exceptional 75.9% |
| Alaska Natives | 95.1 /100 | #115 | Exceptional 75.9% |
| Immigrants | North America | 95.0 /100 | #116 | Exceptional 75.9% |
| Assyrians/Chaldeans/Syriacs | 94.9 /100 | #117 | Exceptional 75.9% |
| Spanish Americans | 94.8 /100 | #118 | Exceptional 75.8% |
Demographics Similar to Soviet Union by In Labor Force | Age 20-24
In terms of in labor force | age 20-24, the demographic groups most similar to Soviet Union are Tsimshian (72.3%, a difference of 0.0%), Immigrants from Ecuador (72.3%, a difference of 0.010%), Immigrants from Jamaica (72.4%, a difference of 0.16%), Immigrants from Singapore (72.4%, a difference of 0.18%), and Immigrants from West Indies (72.4%, a difference of 0.21%).
| Demographics | Rating | Rank | In Labor Force | Age 20-24 |
| Cubans | 0.0 /100 | #301 | Tragic 72.5% |
| Natives/Alaskans | 0.0 /100 | #302 | Tragic 72.4% |
| Ecuadorians | 0.0 /100 | #303 | Tragic 72.4% |
| Immigrants | West Indies | 0.0 /100 | #304 | Tragic 72.4% |
| Immigrants | Singapore | 0.0 /100 | #305 | Tragic 72.4% |
| Immigrants | Jamaica | 0.0 /100 | #306 | Tragic 72.4% |
| Immigrants | Ecuador | 0.0 /100 | #307 | Tragic 72.3% |
| Soviet Union | 0.0 /100 | #308 | Tragic 72.3% |
| Tsimshian | 0.0 /100 | #309 | Tragic 72.3% |
| Immigrants | Cuba | 0.0 /100 | #310 | Tragic 72.0% |
| Apache | 0.0 /100 | #311 | Tragic 72.0% |
| Immigrants | Caribbean | 0.0 /100 | #312 | Tragic 71.9% |
| Immigrants | Dominica | 0.0 /100 | #313 | Tragic 71.9% |
| Indians (Asian) | 0.0 /100 | #314 | Tragic 71.9% |
| Immigrants | Iran | 0.0 /100 | #315 | Tragic 71.8% |