Immigrants from Germany vs Immigrants from Scotland Hearing Disability
COMPARE
Immigrants from Germany
Immigrants from Scotland
Hearing Disability
Hearing Disability Comparison
Immigrants from Germany
Immigrants from Scotland
3.5%
HEARING DISABILITY
0.1/ 100
METRIC RATING
264th/ 347
METRIC RANK
3.3%
HEARING DISABILITY
0.8/ 100
METRIC RATING
245th/ 347
METRIC RANK
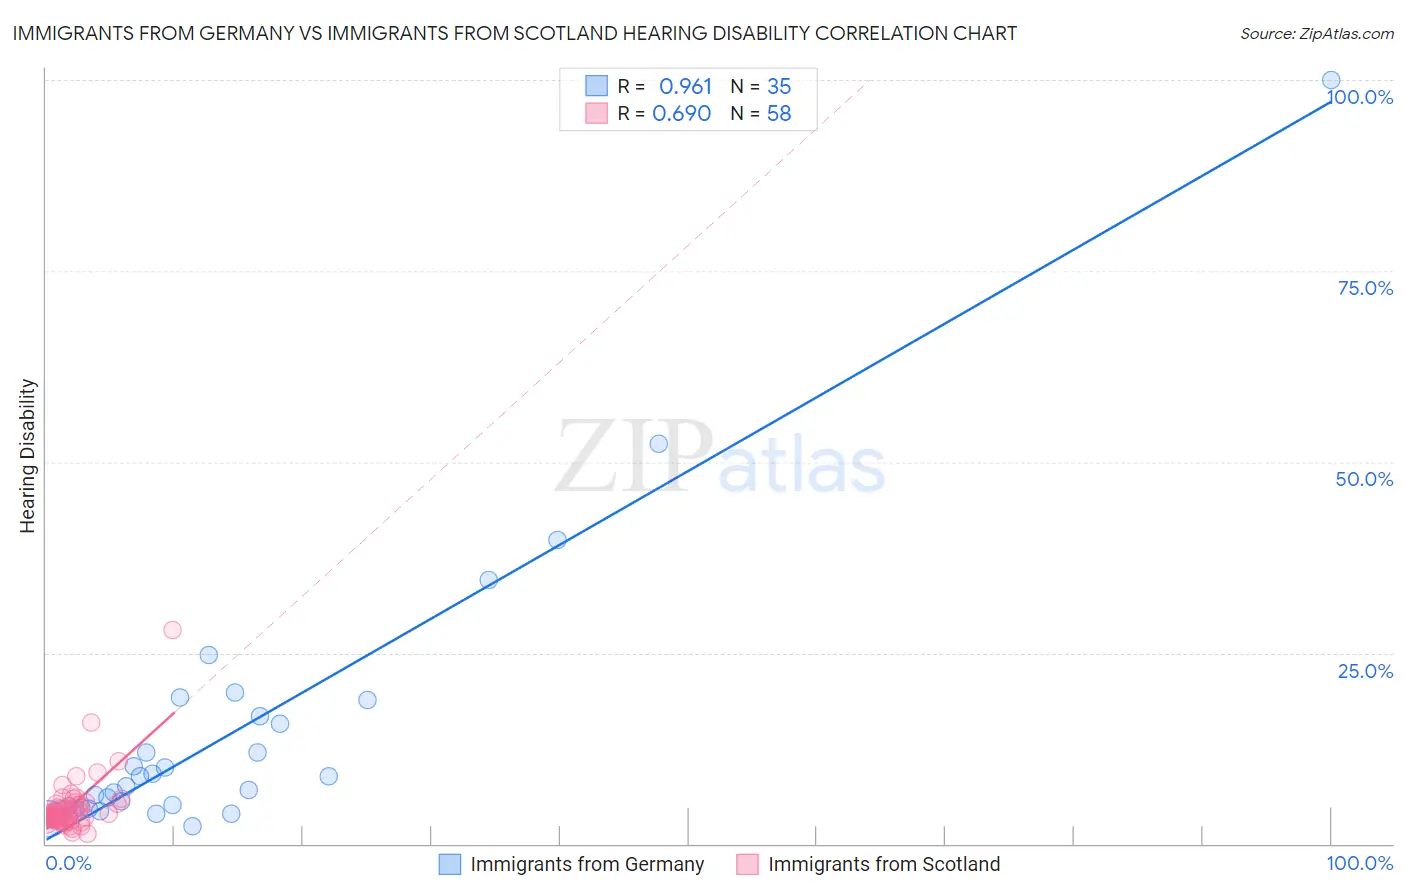
Immigrants from Germany vs Immigrants from Scotland Hearing Disability Correlation Chart
The statistical analysis conducted on geographies consisting of 463,741,390 people shows a perfect positive correlation between the proportion of Immigrants from Germany and percentage of population with hearing disability in the United States with a correlation coefficient (R) of 0.961 and weighted average of 3.5%. Similarly, the statistical analysis conducted on geographies consisting of 196,388,915 people shows a significant positive correlation between the proportion of Immigrants from Scotland and percentage of population with hearing disability in the United States with a correlation coefficient (R) of 0.690 and weighted average of 3.3%, a difference of 4.1%.
Hearing Disability Correlation Summary
| Measurement | Immigrants from Germany | Immigrants from Scotland |
| Minimum | 2.3% | 1.3% |
| Maximum | 100.0% | 27.9% |
| Range | 97.7% | 26.6% |
| Mean | 14.3% | 4.8% |
| Median | 7.5% | 3.8% |
| Interquartile 25% (IQ1) | 4.6% | 3.1% |
| Interquartile 75% (IQ3) | 16.7% | 5.2% |
| Interquartile Range (IQR) | 12.1% | 2.1% |
| Standard Deviation (Sample) | 18.6% | 3.9% |
| Standard Deviation (Population) | 18.3% | 3.9% |
Demographics Similar to Immigrants from Germany and Immigrants from Scotland by Hearing Disability
In terms of hearing disability, the demographic groups most similar to Immigrants from Germany are Immigrants from Canada (3.5%, a difference of 0.22%), Immigrants from North America (3.5%, a difference of 0.26%), Hawaiian (3.5%, a difference of 0.38%), Portuguese (3.5%, a difference of 0.41%), and Slovene (3.5%, a difference of 0.49%). Similarly, the demographic groups most similar to Immigrants from Scotland are Immigrants from England (3.3%, a difference of 0.28%), Assyrian/Chaldean/Syriac (3.3%, a difference of 0.34%), Lithuanian (3.4%, a difference of 0.48%), Austrian (3.4%, a difference of 0.71%), and Italian (3.4%, a difference of 1.2%).
| Demographics | Rating | Rank | Hearing Disability |
| Assyrians/Chaldeans/Syriacs | 0.9 /100 | #244 | Tragic 3.3% |
| Immigrants | Scotland | 0.8 /100 | #245 | Tragic 3.3% |
| Immigrants | England | 0.7 /100 | #246 | Tragic 3.3% |
| Lithuanians | 0.6 /100 | #247 | Tragic 3.4% |
| Austrians | 0.6 /100 | #248 | Tragic 3.4% |
| Italians | 0.4 /100 | #249 | Tragic 3.4% |
| Yuman | 0.4 /100 | #250 | Tragic 3.4% |
| Hungarians | 0.4 /100 | #251 | Tragic 3.4% |
| Croatians | 0.4 /100 | #252 | Tragic 3.4% |
| Carpatho Rusyns | 0.3 /100 | #253 | Tragic 3.4% |
| Slavs | 0.2 /100 | #254 | Tragic 3.4% |
| Poles | 0.2 /100 | #255 | Tragic 3.4% |
| Hmong | 0.2 /100 | #256 | Tragic 3.4% |
| Yaqui | 0.2 /100 | #257 | Tragic 3.4% |
| Northern Europeans | 0.2 /100 | #258 | Tragic 3.4% |
| Slovenes | 0.1 /100 | #259 | Tragic 3.5% |
| Portuguese | 0.1 /100 | #260 | Tragic 3.5% |
| Hawaiians | 0.1 /100 | #261 | Tragic 3.5% |
| Immigrants | North America | 0.1 /100 | #262 | Tragic 3.5% |
| Immigrants | Canada | 0.1 /100 | #263 | Tragic 3.5% |
| Immigrants | Germany | 0.1 /100 | #264 | Tragic 3.5% |