Immigrants from South Central Asia vs Immigrants from Scotland In Labor Force | Age 20-24
COMPARE
Immigrants from South Central Asia
Immigrants from Scotland
In Labor Force | Age 20-24
In Labor Force | Age 20-24 Comparison
Immigrants from South Central Asia
Immigrants from Scotland
74.0%
IN LABOR FORCE | AGE 20-24
1.9/ 100
METRIC RATING
244th/ 347
METRIC RANK
75.8%
IN LABOR FORCE | AGE 20-24
93.7/ 100
METRIC RATING
125th/ 347
METRIC RANK
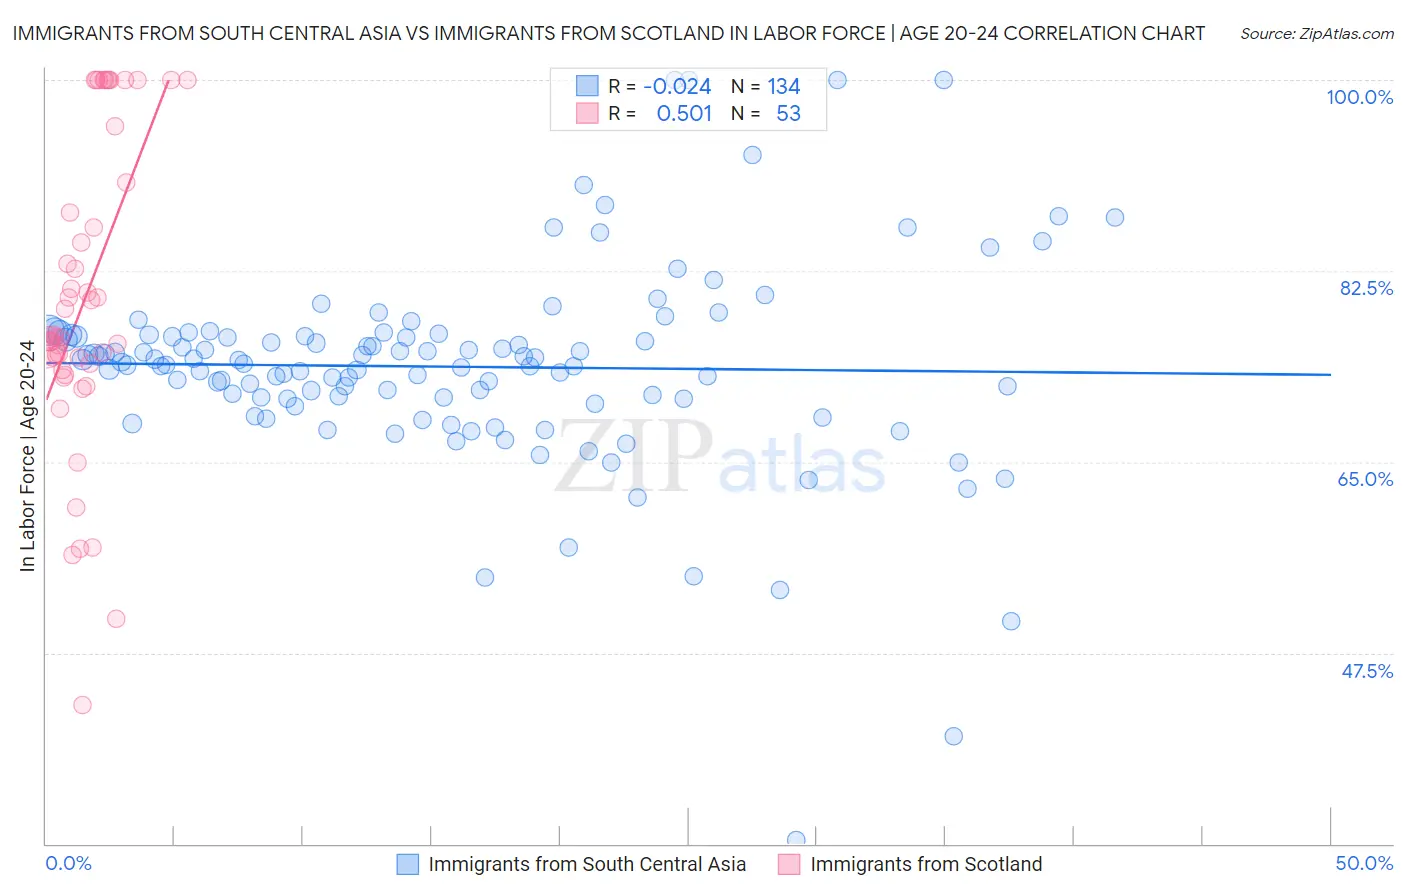
Immigrants from South Central Asia vs Immigrants from Scotland In Labor Force | Age 20-24 Correlation Chart
The statistical analysis conducted on geographies consisting of 472,891,637 people shows no correlation between the proportion of Immigrants from South Central Asia and labor force participation rate among population between the ages 20 and 24 in the United States with a correlation coefficient (R) of -0.024 and weighted average of 74.0%. Similarly, the statistical analysis conducted on geographies consisting of 196,345,554 people shows a substantial positive correlation between the proportion of Immigrants from Scotland and labor force participation rate among population between the ages 20 and 24 in the United States with a correlation coefficient (R) of 0.501 and weighted average of 75.8%, a difference of 2.5%.
In Labor Force | Age 20-24 Correlation Summary
| Measurement | Immigrants from South Central Asia | Immigrants from Scotland |
| Minimum | 30.3% | 42.7% |
| Maximum | 100.0% | 100.0% |
| Range | 69.7% | 57.3% |
| Mean | 73.7% | 80.1% |
| Median | 74.1% | 76.4% |
| Interquartile 25% (IQ1) | 70.8% | 73.7% |
| Interquartile 75% (IQ3) | 76.6% | 93.2% |
| Interquartile Range (IQR) | 5.8% | 19.5% |
| Standard Deviation (Sample) | 9.4% | 14.2% |
| Standard Deviation (Population) | 9.3% | 14.0% |
Similar Demographics by In Labor Force | Age 20-24
Demographics Similar to Immigrants from South Central Asia by In Labor Force | Age 20-24
In terms of in labor force | age 20-24, the demographic groups most similar to Immigrants from South Central Asia are Immigrants from Syria (74.0%, a difference of 0.010%), Turkish (73.9%, a difference of 0.030%), Immigrants from Senegal (74.0%, a difference of 0.040%), Thai (74.0%, a difference of 0.040%), and Immigrants from Panama (73.9%, a difference of 0.060%).
| Demographics | Rating | Rank | In Labor Force | Age 20-24 |
| Bermudans | 3.2 /100 | #237 | Tragic 74.1% |
| Immigrants | Japan | 3.0 /100 | #238 | Tragic 74.1% |
| Immigrants | Latin America | 2.7 /100 | #239 | Tragic 74.1% |
| Immigrants | Sri Lanka | 2.3 /100 | #240 | Tragic 74.0% |
| Immigrants | Senegal | 2.1 /100 | #241 | Tragic 74.0% |
| Thais | 2.1 /100 | #242 | Tragic 74.0% |
| Immigrants | Syria | 1.9 /100 | #243 | Tragic 74.0% |
| Immigrants | South Central Asia | 1.9 /100 | #244 | Tragic 74.0% |
| Turks | 1.8 /100 | #245 | Tragic 73.9% |
| Immigrants | Panama | 1.6 /100 | #246 | Tragic 73.9% |
| Colville | 1.5 /100 | #247 | Tragic 73.9% |
| Immigrants | Saudi Arabia | 1.5 /100 | #248 | Tragic 73.9% |
| Blacks/African Americans | 1.3 /100 | #249 | Tragic 73.9% |
| Immigrants | Belgium | 1.3 /100 | #250 | Tragic 73.9% |
| Immigrants | Egypt | 1.2 /100 | #251 | Tragic 73.8% |
Demographics Similar to Immigrants from Scotland by In Labor Force | Age 20-24
In terms of in labor force | age 20-24, the demographic groups most similar to Immigrants from Scotland are Immigrants from Sierra Leone (75.8%, a difference of 0.010%), Pakistani (75.8%, a difference of 0.030%), Immigrants from Bulgaria (75.8%, a difference of 0.030%), Immigrants from Serbia (75.8%, a difference of 0.040%), and Brazilian (75.8%, a difference of 0.040%).
| Demographics | Rating | Rank | In Labor Force | Age 20-24 |
| Spanish Americans | 94.8 /100 | #118 | Exceptional 75.8% |
| Immigrants | Portugal | 94.8 /100 | #119 | Exceptional 75.8% |
| Immigrants | Africa | 94.6 /100 | #120 | Exceptional 75.8% |
| Immigrants | Serbia | 94.3 /100 | #121 | Exceptional 75.8% |
| Pakistanis | 94.1 /100 | #122 | Exceptional 75.8% |
| Immigrants | Bulgaria | 94.1 /100 | #123 | Exceptional 75.8% |
| Immigrants | Sierra Leone | 93.8 /100 | #124 | Exceptional 75.8% |
| Immigrants | Scotland | 93.7 /100 | #125 | Exceptional 75.8% |
| Brazilians | 93.0 /100 | #126 | Exceptional 75.8% |
| Sub-Saharan Africans | 90.9 /100 | #127 | Exceptional 75.7% |
| Immigrants | Afghanistan | 89.4 /100 | #128 | Excellent 75.6% |
| Iroquois | 89.1 /100 | #129 | Excellent 75.6% |
| Immigrants | Austria | 88.8 /100 | #130 | Excellent 75.6% |
| Immigrants | Jordan | 88.5 /100 | #131 | Excellent 75.6% |
| Palestinians | 88.4 /100 | #132 | Excellent 75.6% |