Burmese vs Immigrants from Korea In Labor Force | Age 16-19
COMPARE
Burmese
Immigrants from Korea
In Labor Force | Age 16-19
In Labor Force | Age 16-19 Comparison
Burmese
Immigrants from Korea
34.5%
IN LABOR FORCE | AGE 16-19
1.1/ 100
METRIC RATING
263rd/ 347
METRIC RANK
33.8%
IN LABOR FORCE | AGE 16-19
0.3/ 100
METRIC RATING
282nd/ 347
METRIC RANK
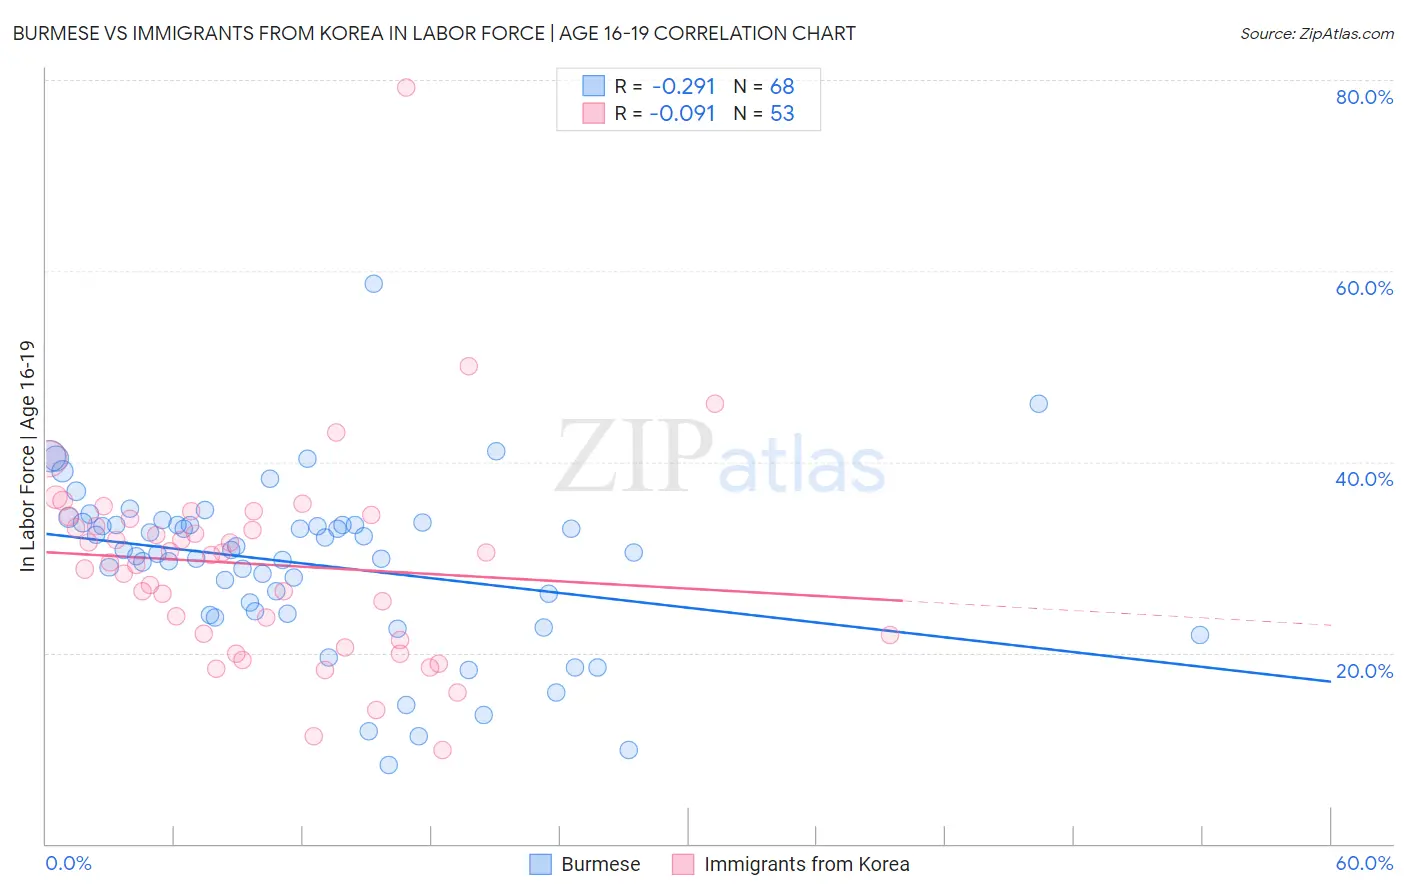
Burmese vs Immigrants from Korea In Labor Force | Age 16-19 Correlation Chart
The statistical analysis conducted on geographies consisting of 464,488,872 people shows a weak negative correlation between the proportion of Burmese and labor force participation rate among population between the ages 16 and 19 in the United States with a correlation coefficient (R) of -0.291 and weighted average of 34.5%. Similarly, the statistical analysis conducted on geographies consisting of 415,630,206 people shows a slight negative correlation between the proportion of Immigrants from Korea and labor force participation rate among population between the ages 16 and 19 in the United States with a correlation coefficient (R) of -0.091 and weighted average of 33.8%, a difference of 2.0%.
In Labor Force | Age 16-19 Correlation Summary
| Measurement | Burmese | Immigrants from Korea |
| Minimum | 8.3% | 9.8% |
| Maximum | 58.6% | 79.2% |
| Range | 50.3% | 69.4% |
| Mean | 29.3% | 29.3% |
| Median | 30.7% | 30.3% |
| Interquartile 25% (IQ1) | 24.3% | 21.6% |
| Interquartile 75% (IQ3) | 33.4% | 34.2% |
| Interquartile Range (IQR) | 9.2% | 12.6% |
| Standard Deviation (Sample) | 8.8% | 10.9% |
| Standard Deviation (Population) | 8.7% | 10.8% |
Demographics Similar to Burmese and Immigrants from Korea by In Labor Force | Age 16-19
In terms of in labor force | age 16-19, the demographic groups most similar to Burmese are Hispanic or Latino (34.5%, a difference of 0.040%), Immigrants from Uruguay (34.4%, a difference of 0.28%), Immigrants from El Salvador (34.3%, a difference of 0.53%), Immigrants from Malaysia (34.3%, a difference of 0.61%), and Immigrants from Peru (34.2%, a difference of 0.97%). Similarly, the demographic groups most similar to Immigrants from Korea are Cypriot (33.8%, a difference of 0.010%), Paraguayan (33.8%, a difference of 0.020%), Taiwanese (33.8%, a difference of 0.020%), Colombian (33.8%, a difference of 0.030%), and Menominee (33.9%, a difference of 0.11%).
| Demographics | Rating | Rank | In Labor Force | Age 16-19 |
| Hispanics or Latinos | 1.1 /100 | #262 | Tragic 34.5% |
| Burmese | 1.1 /100 | #263 | Tragic 34.5% |
| Immigrants | Uruguay | 0.9 /100 | #264 | Tragic 34.4% |
| Immigrants | El Salvador | 0.7 /100 | #265 | Tragic 34.3% |
| Immigrants | Malaysia | 0.7 /100 | #266 | Tragic 34.3% |
| Immigrants | Peru | 0.5 /100 | #267 | Tragic 34.2% |
| Immigrants | Asia | 0.5 /100 | #268 | Tragic 34.1% |
| Pima | 0.5 /100 | #269 | Tragic 34.1% |
| Immigrants | Russia | 0.4 /100 | #270 | Tragic 34.1% |
| Central American Indians | 0.4 /100 | #271 | Tragic 34.1% |
| Asians | 0.4 /100 | #272 | Tragic 34.1% |
| Immigrants | Panama | 0.4 /100 | #273 | Tragic 34.0% |
| Venezuelans | 0.3 /100 | #274 | Tragic 34.0% |
| Immigrants | Fiji | 0.3 /100 | #275 | Tragic 33.9% |
| Immigrants | Latin America | 0.3 /100 | #276 | Tragic 33.9% |
| Menominee | 0.3 /100 | #277 | Tragic 33.9% |
| Colombians | 0.3 /100 | #278 | Tragic 33.8% |
| Paraguayans | 0.3 /100 | #279 | Tragic 33.8% |
| Taiwanese | 0.3 /100 | #280 | Tragic 33.8% |
| Cypriots | 0.3 /100 | #281 | Tragic 33.8% |
| Immigrants | Korea | 0.3 /100 | #282 | Tragic 33.8% |