Mexican American Indian vs Immigrants from Korea In Labor Force | Age 16-19
COMPARE
Mexican American Indian
Immigrants from Korea
In Labor Force | Age 16-19
In Labor Force | Age 16-19 Comparison
Mexican American Indians
Immigrants from Korea
36.0%
IN LABOR FORCE | AGE 16-19
21.1/ 100
METRIC RATING
196th/ 347
METRIC RANK
33.8%
IN LABOR FORCE | AGE 16-19
0.3/ 100
METRIC RATING
282nd/ 347
METRIC RANK
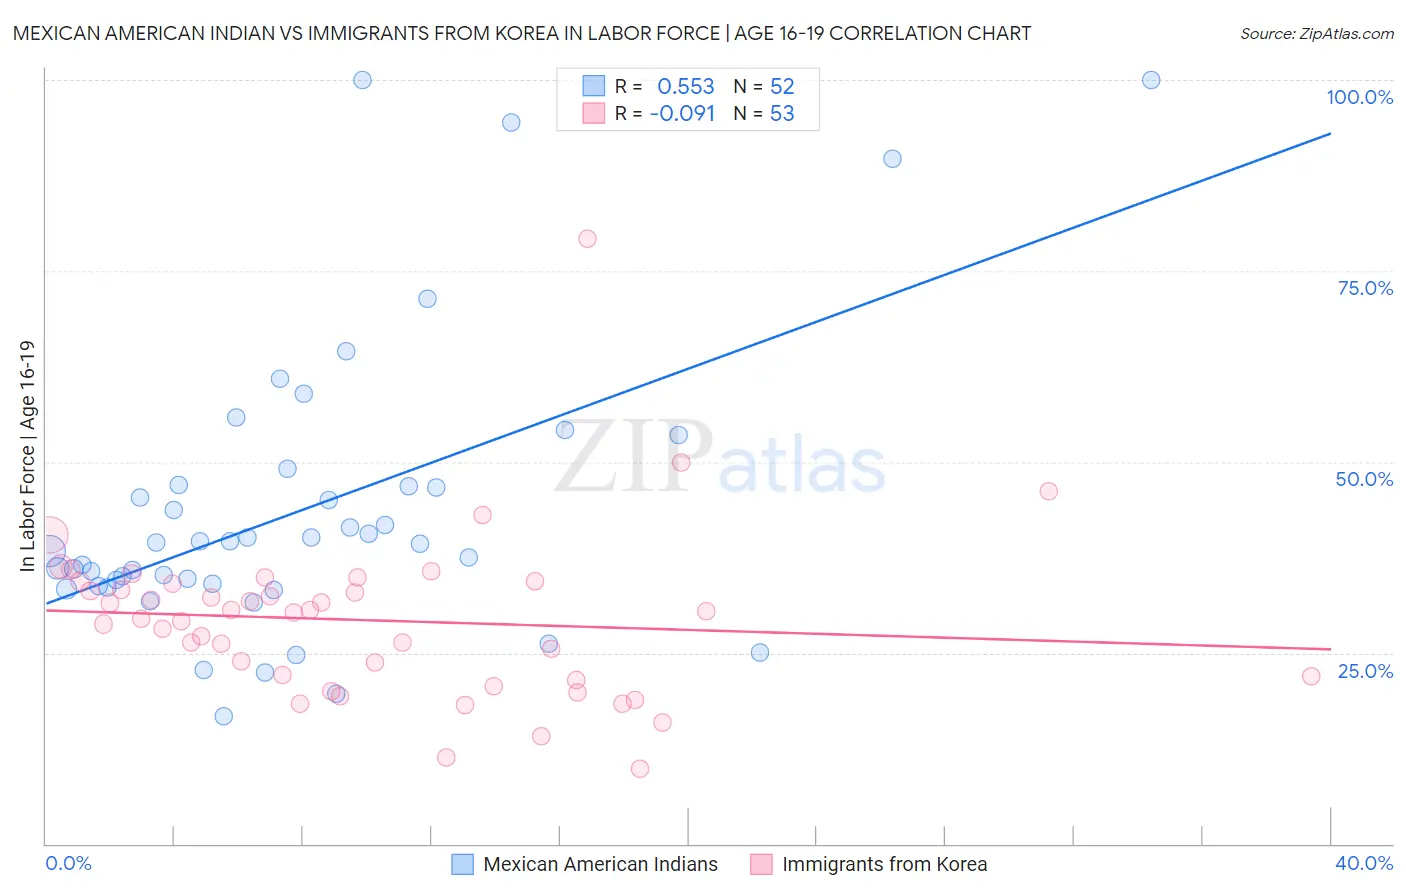
Mexican American Indian vs Immigrants from Korea In Labor Force | Age 16-19 Correlation Chart
The statistical analysis conducted on geographies consisting of 317,325,894 people shows a substantial positive correlation between the proportion of Mexican American Indians and labor force participation rate among population between the ages 16 and 19 in the United States with a correlation coefficient (R) of 0.553 and weighted average of 36.0%. Similarly, the statistical analysis conducted on geographies consisting of 415,630,206 people shows a slight negative correlation between the proportion of Immigrants from Korea and labor force participation rate among population between the ages 16 and 19 in the United States with a correlation coefficient (R) of -0.091 and weighted average of 33.8%, a difference of 6.3%.
In Labor Force | Age 16-19 Correlation Summary
| Measurement | Mexican American Indian | Immigrants from Korea |
| Minimum | 16.6% | 9.8% |
| Maximum | 100.0% | 79.2% |
| Range | 83.4% | 69.4% |
| Mean | 43.7% | 29.3% |
| Median | 39.4% | 30.3% |
| Interquartile 25% (IQ1) | 33.9% | 21.6% |
| Interquartile 75% (IQ3) | 46.8% | 34.2% |
| Interquartile Range (IQR) | 12.9% | 12.6% |
| Standard Deviation (Sample) | 18.8% | 10.9% |
| Standard Deviation (Population) | 18.6% | 10.8% |
Similar Demographics by In Labor Force | Age 16-19
Demographics Similar to Mexican American Indians by In Labor Force | Age 16-19
In terms of in labor force | age 16-19, the demographic groups most similar to Mexican American Indians are Immigrants from Serbia (36.0%, a difference of 0.010%), Immigrants from Northern Africa (35.9%, a difference of 0.090%), Immigrants from Norway (35.9%, a difference of 0.10%), Bolivian (36.0%, a difference of 0.16%), and Immigrants from Sweden (35.9%, a difference of 0.18%).
| Demographics | Rating | Rank | In Labor Force | Age 16-19 |
| Immigrants | Hungary | 28.8 /100 | #189 | Fair 36.2% |
| Panamanians | 28.6 /100 | #190 | Fair 36.1% |
| Immigrants | Croatia | 27.5 /100 | #191 | Fair 36.1% |
| Afghans | 25.7 /100 | #192 | Fair 36.1% |
| Immigrants | Denmark | 25.0 /100 | #193 | Fair 36.1% |
| Nigerians | 24.6 /100 | #194 | Fair 36.1% |
| Bolivians | 23.3 /100 | #195 | Fair 36.0% |
| Mexican American Indians | 21.1 /100 | #196 | Fair 36.0% |
| Immigrants | Serbia | 21.0 /100 | #197 | Fair 36.0% |
| Immigrants | Northern Africa | 19.9 /100 | #198 | Poor 35.9% |
| Immigrants | Norway | 19.8 /100 | #199 | Poor 35.9% |
| Immigrants | Sweden | 18.8 /100 | #200 | Poor 35.9% |
| Alsatians | 17.5 /100 | #201 | Poor 35.9% |
| Senegalese | 17.4 /100 | #202 | Poor 35.9% |
| Immigrants | Nigeria | 16.8 /100 | #203 | Poor 35.8% |
Demographics Similar to Immigrants from Korea by In Labor Force | Age 16-19
In terms of in labor force | age 16-19, the demographic groups most similar to Immigrants from Korea are Cypriot (33.8%, a difference of 0.010%), Paraguayan (33.8%, a difference of 0.020%), Taiwanese (33.8%, a difference of 0.020%), Colombian (33.8%, a difference of 0.030%), and Menominee (33.9%, a difference of 0.11%).
| Demographics | Rating | Rank | In Labor Force | Age 16-19 |
| Immigrants | Fiji | 0.3 /100 | #275 | Tragic 33.9% |
| Immigrants | Latin America | 0.3 /100 | #276 | Tragic 33.9% |
| Menominee | 0.3 /100 | #277 | Tragic 33.9% |
| Colombians | 0.3 /100 | #278 | Tragic 33.8% |
| Paraguayans | 0.3 /100 | #279 | Tragic 33.8% |
| Taiwanese | 0.3 /100 | #280 | Tragic 33.8% |
| Cypriots | 0.3 /100 | #281 | Tragic 33.8% |
| Immigrants | Korea | 0.3 /100 | #282 | Tragic 33.8% |
| Immigrants | Venezuela | 0.2 /100 | #283 | Tragic 33.7% |
| Immigrants | Spain | 0.2 /100 | #284 | Tragic 33.7% |
| U.S. Virgin Islanders | 0.2 /100 | #285 | Tragic 33.6% |
| South Americans | 0.2 /100 | #286 | Tragic 33.6% |
| Nepalese | 0.1 /100 | #287 | Tragic 33.5% |
| Immigrants | Indonesia | 0.1 /100 | #288 | Tragic 33.5% |
| Immigrants | Singapore | 0.1 /100 | #289 | Tragic 33.5% |