Immigrants from Western Europe vs Immigrants from Korea In Labor Force | Age 16-19
COMPARE
Immigrants from Western Europe
Immigrants from Korea
In Labor Force | Age 16-19
In Labor Force | Age 16-19 Comparison
Immigrants from Western Europe
Immigrants from Korea
37.5%
IN LABOR FORCE | AGE 16-19
88.9/ 100
METRIC RATING
146th/ 347
METRIC RANK
33.8%
IN LABOR FORCE | AGE 16-19
0.3/ 100
METRIC RATING
282nd/ 347
METRIC RANK
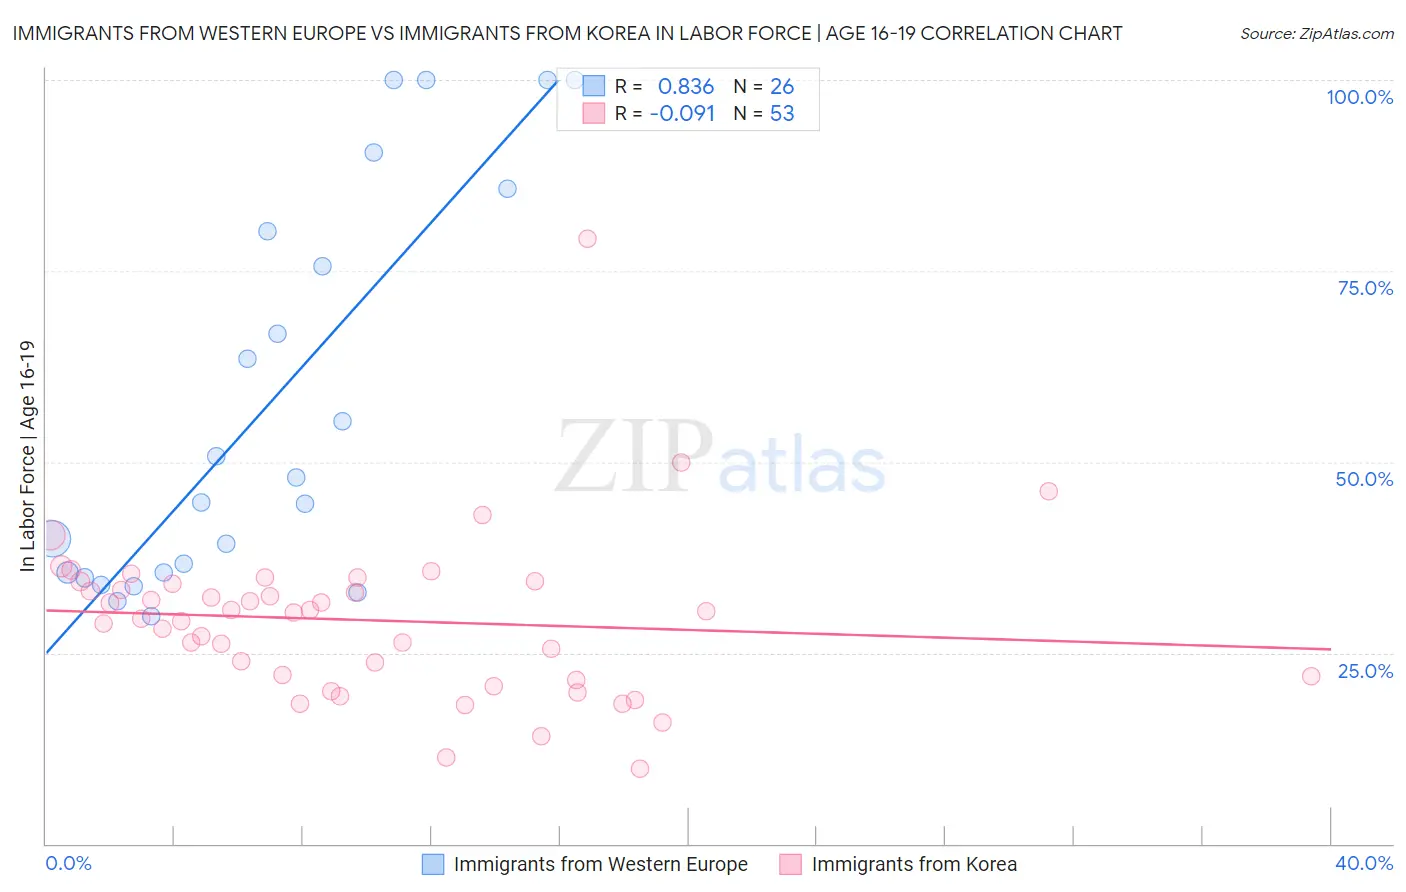
Immigrants from Western Europe vs Immigrants from Korea In Labor Force | Age 16-19 Correlation Chart
The statistical analysis conducted on geographies consisting of 492,395,193 people shows a very strong positive correlation between the proportion of Immigrants from Western Europe and labor force participation rate among population between the ages 16 and 19 in the United States with a correlation coefficient (R) of 0.836 and weighted average of 37.5%. Similarly, the statistical analysis conducted on geographies consisting of 415,630,206 people shows a slight negative correlation between the proportion of Immigrants from Korea and labor force participation rate among population between the ages 16 and 19 in the United States with a correlation coefficient (R) of -0.091 and weighted average of 33.8%, a difference of 11.0%.
In Labor Force | Age 16-19 Correlation Summary
| Measurement | Immigrants from Western Europe | Immigrants from Korea |
| Minimum | 29.8% | 9.8% |
| Maximum | 100.0% | 79.2% |
| Range | 70.2% | 69.4% |
| Mean | 57.3% | 29.3% |
| Median | 46.3% | 30.3% |
| Interquartile 25% (IQ1) | 35.5% | 21.6% |
| Interquartile 75% (IQ3) | 80.2% | 34.2% |
| Interquartile Range (IQR) | 44.7% | 12.6% |
| Standard Deviation (Sample) | 25.5% | 10.9% |
| Standard Deviation (Population) | 25.0% | 10.8% |
Similar Demographics by In Labor Force | Age 16-19
Demographics Similar to Immigrants from Western Europe by In Labor Force | Age 16-19
In terms of in labor force | age 16-19, the demographic groups most similar to Immigrants from Western Europe are Brazilian (37.5%, a difference of 0.030%), Japanese (37.5%, a difference of 0.050%), Paiute (37.5%, a difference of 0.050%), Pakistani (37.6%, a difference of 0.070%), and Sierra Leonean (37.6%, a difference of 0.10%).
| Demographics | Rating | Rank | In Labor Force | Age 16-19 |
| Immigrants | Moldova | 91.9 /100 | #139 | Exceptional 37.7% |
| Estonians | 91.7 /100 | #140 | Exceptional 37.7% |
| Syrians | 90.7 /100 | #141 | Exceptional 37.6% |
| Sierra Leoneans | 89.7 /100 | #142 | Excellent 37.6% |
| Pakistanis | 89.5 /100 | #143 | Excellent 37.6% |
| Japanese | 89.3 /100 | #144 | Excellent 37.5% |
| Paiute | 89.3 /100 | #145 | Excellent 37.5% |
| Immigrants | Western Europe | 88.9 /100 | #146 | Excellent 37.5% |
| Brazilians | 88.7 /100 | #147 | Excellent 37.5% |
| Romanians | 87.3 /100 | #148 | Excellent 37.5% |
| Native Hawaiians | 85.0 /100 | #149 | Excellent 37.4% |
| Tsimshian | 84.7 /100 | #150 | Excellent 37.4% |
| Immigrants | Poland | 84.4 /100 | #151 | Excellent 37.3% |
| Immigrants | Sierra Leone | 83.6 /100 | #152 | Excellent 37.3% |
| Arapaho | 81.8 /100 | #153 | Excellent 37.3% |
Demographics Similar to Immigrants from Korea by In Labor Force | Age 16-19
In terms of in labor force | age 16-19, the demographic groups most similar to Immigrants from Korea are Cypriot (33.8%, a difference of 0.010%), Paraguayan (33.8%, a difference of 0.020%), Taiwanese (33.8%, a difference of 0.020%), Colombian (33.8%, a difference of 0.030%), and Menominee (33.9%, a difference of 0.11%).
| Demographics | Rating | Rank | In Labor Force | Age 16-19 |
| Immigrants | Fiji | 0.3 /100 | #275 | Tragic 33.9% |
| Immigrants | Latin America | 0.3 /100 | #276 | Tragic 33.9% |
| Menominee | 0.3 /100 | #277 | Tragic 33.9% |
| Colombians | 0.3 /100 | #278 | Tragic 33.8% |
| Paraguayans | 0.3 /100 | #279 | Tragic 33.8% |
| Taiwanese | 0.3 /100 | #280 | Tragic 33.8% |
| Cypriots | 0.3 /100 | #281 | Tragic 33.8% |
| Immigrants | Korea | 0.3 /100 | #282 | Tragic 33.8% |
| Immigrants | Venezuela | 0.2 /100 | #283 | Tragic 33.7% |
| Immigrants | Spain | 0.2 /100 | #284 | Tragic 33.7% |
| U.S. Virgin Islanders | 0.2 /100 | #285 | Tragic 33.6% |
| South Americans | 0.2 /100 | #286 | Tragic 33.6% |
| Nepalese | 0.1 /100 | #287 | Tragic 33.5% |
| Immigrants | Indonesia | 0.1 /100 | #288 | Tragic 33.5% |
| Immigrants | Singapore | 0.1 /100 | #289 | Tragic 33.5% |