Immigrants from Fiji vs Mexican American Indian In Labor Force | Age 45-54
COMPARE
Immigrants from Fiji
Mexican American Indian
In Labor Force | Age 45-54
In Labor Force | Age 45-54 Comparison
Immigrants from Fiji
Mexican American Indians
81.5%
IN LABOR FORCE | AGE 45-54
0.1/ 100
METRIC RATING
258th/ 347
METRIC RANK
80.7%
IN LABOR FORCE | AGE 45-54
0.0/ 100
METRIC RATING
290th/ 347
METRIC RANK
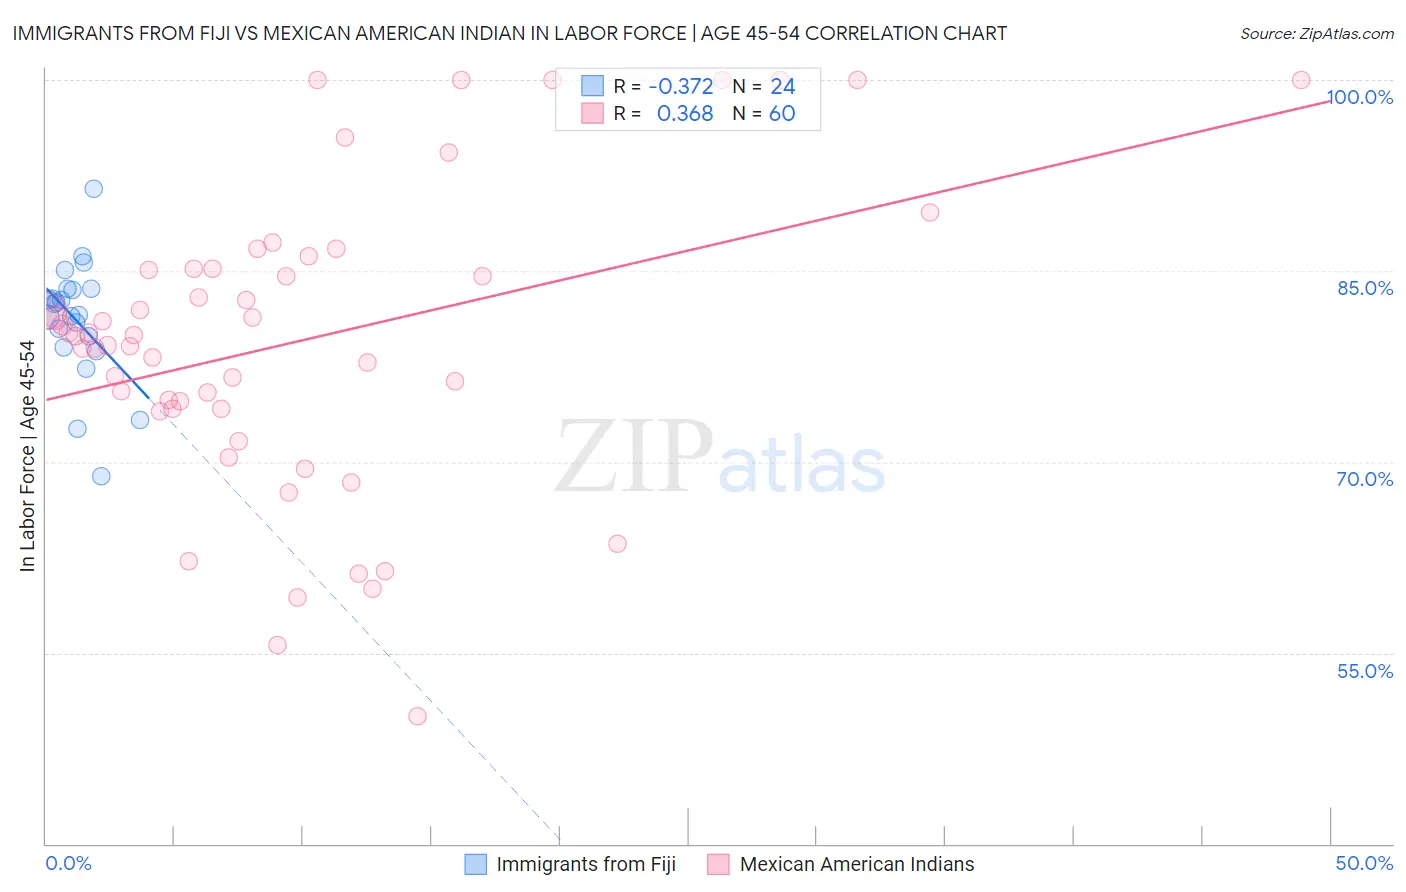
Immigrants from Fiji vs Mexican American Indian In Labor Force | Age 45-54 Correlation Chart
The statistical analysis conducted on geographies consisting of 93,754,712 people shows a mild negative correlation between the proportion of Immigrants from Fiji and labor force participation rate among population between the ages 45 and 54 in the United States with a correlation coefficient (R) of -0.372 and weighted average of 81.5%. Similarly, the statistical analysis conducted on geographies consisting of 317,497,854 people shows a mild positive correlation between the proportion of Mexican American Indians and labor force participation rate among population between the ages 45 and 54 in the United States with a correlation coefficient (R) of 0.368 and weighted average of 80.7%, a difference of 1.0%.
In Labor Force | Age 45-54 Correlation Summary
| Measurement | Immigrants from Fiji | Mexican American Indian |
| Minimum | 68.9% | 50.0% |
| Maximum | 91.5% | 100.0% |
| Range | 22.6% | 50.0% |
| Mean | 81.2% | 79.5% |
| Median | 82.0% | 80.0% |
| Interquartile 25% (IQ1) | 79.5% | 74.2% |
| Interquartile 75% (IQ3) | 83.6% | 85.1% |
| Interquartile Range (IQR) | 4.1% | 11.0% |
| Standard Deviation (Sample) | 4.7% | 11.7% |
| Standard Deviation (Population) | 4.6% | 11.6% |
Similar Demographics by In Labor Force | Age 45-54
Demographics Similar to Immigrants from Fiji by In Labor Force | Age 45-54
In terms of in labor force | age 45-54, the demographic groups most similar to Immigrants from Fiji are Immigrants from Congo (81.6%, a difference of 0.010%), Guyanese (81.5%, a difference of 0.010%), Barbadian (81.6%, a difference of 0.030%), Spaniard (81.5%, a difference of 0.030%), and Hawaiian (81.5%, a difference of 0.050%).
| Demographics | Rating | Rank | In Labor Force | Age 45-54 |
| Guamanians/Chamorros | 0.2 /100 | #251 | Tragic 81.6% |
| Pennsylvania Germans | 0.2 /100 | #252 | Tragic 81.6% |
| Japanese | 0.2 /100 | #253 | Tragic 81.6% |
| Immigrants | Laos | 0.2 /100 | #254 | Tragic 81.6% |
| Scotch-Irish | 0.2 /100 | #255 | Tragic 81.6% |
| Barbadians | 0.1 /100 | #256 | Tragic 81.6% |
| Immigrants | Congo | 0.1 /100 | #257 | Tragic 81.6% |
| Immigrants | Fiji | 0.1 /100 | #258 | Tragic 81.5% |
| Guyanese | 0.1 /100 | #259 | Tragic 81.5% |
| Spaniards | 0.1 /100 | #260 | Tragic 81.5% |
| Hawaiians | 0.1 /100 | #261 | Tragic 81.5% |
| Immigrants | Guyana | 0.1 /100 | #262 | Tragic 81.5% |
| Indonesians | 0.1 /100 | #263 | Tragic 81.5% |
| Immigrants | West Indies | 0.1 /100 | #264 | Tragic 81.5% |
| Hondurans | 0.1 /100 | #265 | Tragic 81.4% |
Demographics Similar to Mexican American Indians by In Labor Force | Age 45-54
In terms of in labor force | age 45-54, the demographic groups most similar to Mexican American Indians are Immigrants from Bangladesh (80.7%, a difference of 0.030%), Cree (80.8%, a difference of 0.060%), Delaware (80.8%, a difference of 0.070%), Immigrants from Dominica (80.8%, a difference of 0.070%), and Vietnamese (80.8%, a difference of 0.070%).
| Demographics | Rating | Rank | In Labor Force | Age 45-54 |
| French American Indians | 0.0 /100 | #283 | Tragic 80.8% |
| Belizeans | 0.0 /100 | #284 | Tragic 80.8% |
| Delaware | 0.0 /100 | #285 | Tragic 80.8% |
| Immigrants | Dominica | 0.0 /100 | #286 | Tragic 80.8% |
| Vietnamese | 0.0 /100 | #287 | Tragic 80.8% |
| Cree | 0.0 /100 | #288 | Tragic 80.8% |
| Immigrants | Bangladesh | 0.0 /100 | #289 | Tragic 80.7% |
| Mexican American Indians | 0.0 /100 | #290 | Tragic 80.7% |
| Immigrants | Belize | 0.0 /100 | #291 | Tragic 80.6% |
| Iroquois | 0.0 /100 | #292 | Tragic 80.6% |
| Osage | 0.0 /100 | #293 | Tragic 80.6% |
| Yakama | 0.0 /100 | #294 | Tragic 80.6% |
| Nepalese | 0.0 /100 | #295 | Tragic 80.5% |
| Africans | 0.0 /100 | #296 | Tragic 80.5% |
| Americans | 0.0 /100 | #297 | Tragic 80.4% |