Immigrants from Fiji vs Immigrants from Scotland In Labor Force | Age 45-54
COMPARE
Immigrants from Fiji
Immigrants from Scotland
In Labor Force | Age 45-54
In Labor Force | Age 45-54 Comparison
Immigrants from Fiji
Immigrants from Scotland
81.5%
IN LABOR FORCE | AGE 45-54
0.1/ 100
METRIC RATING
258th/ 347
METRIC RANK
83.0%
IN LABOR FORCE | AGE 45-54
77.8/ 100
METRIC RATING
142nd/ 347
METRIC RANK
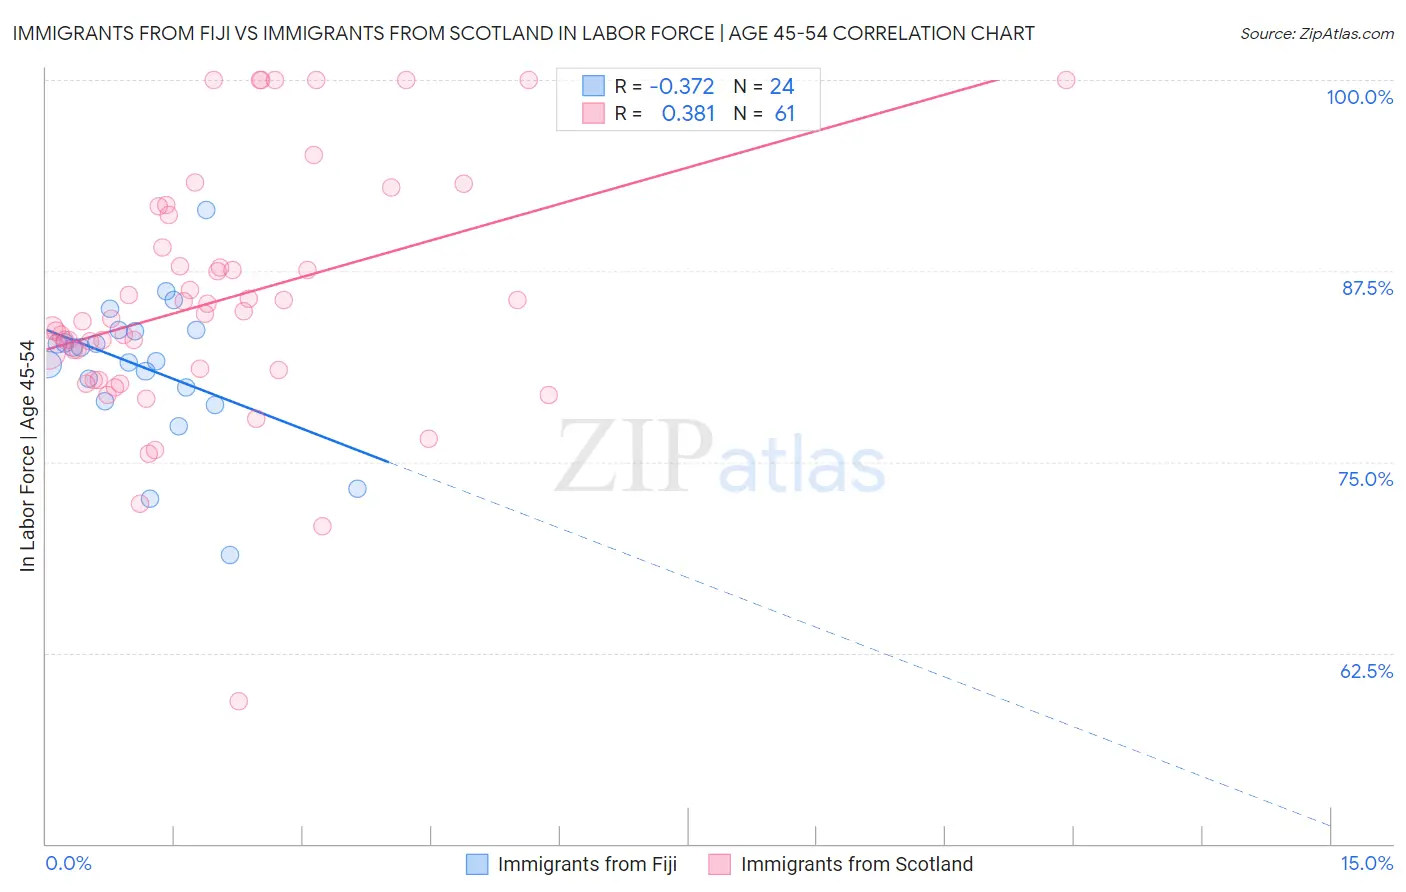
Immigrants from Fiji vs Immigrants from Scotland In Labor Force | Age 45-54 Correlation Chart
The statistical analysis conducted on geographies consisting of 93,754,712 people shows a mild negative correlation between the proportion of Immigrants from Fiji and labor force participation rate among population between the ages 45 and 54 in the United States with a correlation coefficient (R) of -0.372 and weighted average of 81.5%. Similarly, the statistical analysis conducted on geographies consisting of 196,370,996 people shows a mild positive correlation between the proportion of Immigrants from Scotland and labor force participation rate among population between the ages 45 and 54 in the United States with a correlation coefficient (R) of 0.381 and weighted average of 83.0%, a difference of 1.8%.
In Labor Force | Age 45-54 Correlation Summary
| Measurement | Immigrants from Fiji | Immigrants from Scotland |
| Minimum | 68.9% | 59.3% |
| Maximum | 91.5% | 100.0% |
| Range | 22.6% | 40.7% |
| Mean | 81.2% | 85.6% |
| Median | 82.0% | 84.4% |
| Interquartile 25% (IQ1) | 79.5% | 80.7% |
| Interquartile 75% (IQ3) | 83.6% | 90.1% |
| Interquartile Range (IQR) | 4.1% | 9.4% |
| Standard Deviation (Sample) | 4.7% | 8.1% |
| Standard Deviation (Population) | 4.6% | 8.0% |
Similar Demographics by In Labor Force | Age 45-54
Demographics Similar to Immigrants from Fiji by In Labor Force | Age 45-54
In terms of in labor force | age 45-54, the demographic groups most similar to Immigrants from Fiji are Immigrants from Congo (81.6%, a difference of 0.010%), Guyanese (81.5%, a difference of 0.010%), Barbadian (81.6%, a difference of 0.030%), Spaniard (81.5%, a difference of 0.030%), and Hawaiian (81.5%, a difference of 0.050%).
| Demographics | Rating | Rank | In Labor Force | Age 45-54 |
| Guamanians/Chamorros | 0.2 /100 | #251 | Tragic 81.6% |
| Pennsylvania Germans | 0.2 /100 | #252 | Tragic 81.6% |
| Japanese | 0.2 /100 | #253 | Tragic 81.6% |
| Immigrants | Laos | 0.2 /100 | #254 | Tragic 81.6% |
| Scotch-Irish | 0.2 /100 | #255 | Tragic 81.6% |
| Barbadians | 0.1 /100 | #256 | Tragic 81.6% |
| Immigrants | Congo | 0.1 /100 | #257 | Tragic 81.6% |
| Immigrants | Fiji | 0.1 /100 | #258 | Tragic 81.5% |
| Guyanese | 0.1 /100 | #259 | Tragic 81.5% |
| Spaniards | 0.1 /100 | #260 | Tragic 81.5% |
| Hawaiians | 0.1 /100 | #261 | Tragic 81.5% |
| Immigrants | Guyana | 0.1 /100 | #262 | Tragic 81.5% |
| Indonesians | 0.1 /100 | #263 | Tragic 81.5% |
| Immigrants | West Indies | 0.1 /100 | #264 | Tragic 81.5% |
| Hondurans | 0.1 /100 | #265 | Tragic 81.4% |
Demographics Similar to Immigrants from Scotland by In Labor Force | Age 45-54
In terms of in labor force | age 45-54, the demographic groups most similar to Immigrants from Scotland are Immigrants from Haiti (83.0%, a difference of 0.0%), Scandinavian (83.0%, a difference of 0.010%), Yugoslavian (83.0%, a difference of 0.010%), Okinawan (83.0%, a difference of 0.010%), and Soviet Union (83.0%, a difference of 0.010%).
| Demographics | Rating | Rank | In Labor Force | Age 45-54 |
| Austrians | 81.3 /100 | #135 | Excellent 83.0% |
| Immigrants | Kazakhstan | 81.0 /100 | #136 | Excellent 83.0% |
| Immigrants | Spain | 80.4 /100 | #137 | Excellent 83.0% |
| Ghanaians | 79.5 /100 | #138 | Good 83.0% |
| Scandinavians | 78.5 /100 | #139 | Good 83.0% |
| Yugoslavians | 78.3 /100 | #140 | Good 83.0% |
| Immigrants | Haiti | 77.9 /100 | #141 | Good 83.0% |
| Immigrants | Scotland | 77.8 /100 | #142 | Good 83.0% |
| Okinawans | 77.0 /100 | #143 | Good 83.0% |
| Soviet Union | 76.8 /100 | #144 | Good 83.0% |
| Romanians | 75.4 /100 | #145 | Good 83.0% |
| Immigrants | France | 75.3 /100 | #146 | Good 83.0% |
| Czechoslovakians | 74.8 /100 | #147 | Good 83.0% |
| Immigrants | Nigeria | 74.1 /100 | #148 | Good 83.0% |
| Immigrants | Sweden | 73.3 /100 | #149 | Good 82.9% |