Swedish vs Immigrants from Bulgaria In Labor Force | Age 20-24
COMPARE
Swedish
Immigrants from Bulgaria
In Labor Force | Age 20-24
In Labor Force | Age 20-24 Comparison
Swedes
Immigrants from Bulgaria
78.8%
IN LABOR FORCE | AGE 20-24
100.0/ 100
METRIC RATING
9th/ 347
METRIC RANK
75.8%
IN LABOR FORCE | AGE 20-24
94.1/ 100
METRIC RATING
123rd/ 347
METRIC RANK
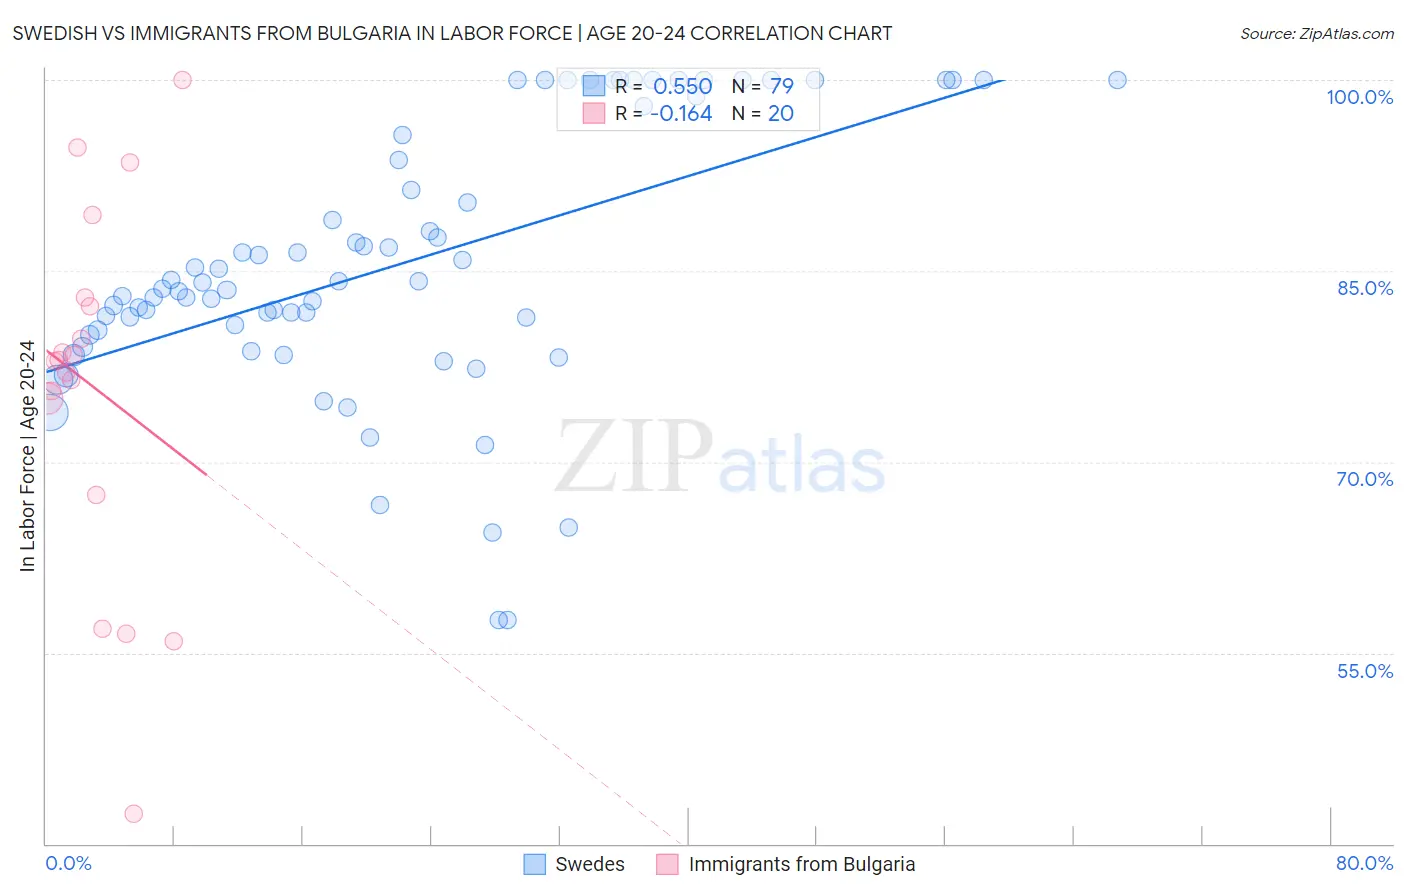
Swedish vs Immigrants from Bulgaria In Labor Force | Age 20-24 Correlation Chart
The statistical analysis conducted on geographies consisting of 538,164,941 people shows a substantial positive correlation between the proportion of Swedes and labor force participation rate among population between the ages 20 and 24 in the United States with a correlation coefficient (R) of 0.550 and weighted average of 78.8%. Similarly, the statistical analysis conducted on geographies consisting of 172,510,065 people shows a poor negative correlation between the proportion of Immigrants from Bulgaria and labor force participation rate among population between the ages 20 and 24 in the United States with a correlation coefficient (R) of -0.164 and weighted average of 75.8%, a difference of 4.0%.
In Labor Force | Age 20-24 Correlation Summary
| Measurement | Swedish | Immigrants from Bulgaria |
| Minimum | 57.6% | 42.4% |
| Maximum | 100.0% | 100.0% |
| Range | 42.4% | 57.6% |
| Mean | 85.4% | 75.9% |
| Median | 83.6% | 77.9% |
| Interquartile 25% (IQ1) | 80.0% | 71.2% |
| Interquartile 75% (IQ3) | 95.6% | 82.6% |
| Interquartile Range (IQR) | 15.7% | 11.4% |
| Standard Deviation (Sample) | 10.4% | 14.3% |
| Standard Deviation (Population) | 10.4% | 13.9% |
Similar Demographics by In Labor Force | Age 20-24
Demographics Similar to Swedes by In Labor Force | Age 20-24
In terms of in labor force | age 20-24, the demographic groups most similar to Swedes are Immigrants from Cabo Verde (78.9%, a difference of 0.070%), Slovene (78.7%, a difference of 0.16%), Luxembourger (79.0%, a difference of 0.17%), Finnish (78.7%, a difference of 0.19%), and Danish (79.0%, a difference of 0.21%).
| Demographics | Rating | Rank | In Labor Force | Age 20-24 |
| Immigrants | Somalia | 100.0 /100 | #2 | Exceptional 79.5% |
| Somalis | 100.0 /100 | #3 | Exceptional 79.3% |
| Alaskan Athabascans | 100.0 /100 | #4 | Exceptional 79.1% |
| Aleuts | 100.0 /100 | #5 | Exceptional 79.0% |
| Danes | 100.0 /100 | #6 | Exceptional 79.0% |
| Luxembourgers | 100.0 /100 | #7 | Exceptional 79.0% |
| Immigrants | Cabo Verde | 100.0 /100 | #8 | Exceptional 78.9% |
| Swedes | 100.0 /100 | #9 | Exceptional 78.8% |
| Slovenes | 100.0 /100 | #10 | Exceptional 78.7% |
| Finns | 100.0 /100 | #11 | Exceptional 78.7% |
| Germans | 100.0 /100 | #12 | Exceptional 78.6% |
| Scandinavians | 100.0 /100 | #13 | Exceptional 78.5% |
| Czechs | 100.0 /100 | #14 | Exceptional 78.5% |
| Sudanese | 100.0 /100 | #15 | Exceptional 78.4% |
| Dutch | 100.0 /100 | #16 | Exceptional 78.4% |
Demographics Similar to Immigrants from Bulgaria by In Labor Force | Age 20-24
In terms of in labor force | age 20-24, the demographic groups most similar to Immigrants from Bulgaria are Pakistani (75.8%, a difference of 0.0%), Immigrants from Serbia (75.8%, a difference of 0.010%), Immigrants from Sierra Leone (75.8%, a difference of 0.020%), Immigrants from Scotland (75.8%, a difference of 0.030%), and Immigrants from Africa (75.8%, a difference of 0.040%).
| Demographics | Rating | Rank | In Labor Force | Age 20-24 |
| Immigrants | North America | 95.0 /100 | #116 | Exceptional 75.9% |
| Assyrians/Chaldeans/Syriacs | 94.9 /100 | #117 | Exceptional 75.9% |
| Spanish Americans | 94.8 /100 | #118 | Exceptional 75.8% |
| Immigrants | Portugal | 94.8 /100 | #119 | Exceptional 75.8% |
| Immigrants | Africa | 94.6 /100 | #120 | Exceptional 75.8% |
| Immigrants | Serbia | 94.3 /100 | #121 | Exceptional 75.8% |
| Pakistanis | 94.1 /100 | #122 | Exceptional 75.8% |
| Immigrants | Bulgaria | 94.1 /100 | #123 | Exceptional 75.8% |
| Immigrants | Sierra Leone | 93.8 /100 | #124 | Exceptional 75.8% |
| Immigrants | Scotland | 93.7 /100 | #125 | Exceptional 75.8% |
| Brazilians | 93.0 /100 | #126 | Exceptional 75.8% |
| Sub-Saharan Africans | 90.9 /100 | #127 | Exceptional 75.7% |
| Immigrants | Afghanistan | 89.4 /100 | #128 | Excellent 75.6% |
| Iroquois | 89.1 /100 | #129 | Excellent 75.6% |
| Immigrants | Austria | 88.8 /100 | #130 | Excellent 75.6% |