Immigrants from Pakistan vs Immigrants from Bulgaria In Labor Force | Age 20-24
COMPARE
Immigrants from Pakistan
Immigrants from Bulgaria
In Labor Force | Age 20-24
In Labor Force | Age 20-24 Comparison
Immigrants from Pakistan
Immigrants from Bulgaria
73.8%
IN LABOR FORCE | AGE 20-24
0.9/ 100
METRIC RATING
255th/ 347
METRIC RANK
75.8%
IN LABOR FORCE | AGE 20-24
94.1/ 100
METRIC RATING
123rd/ 347
METRIC RANK
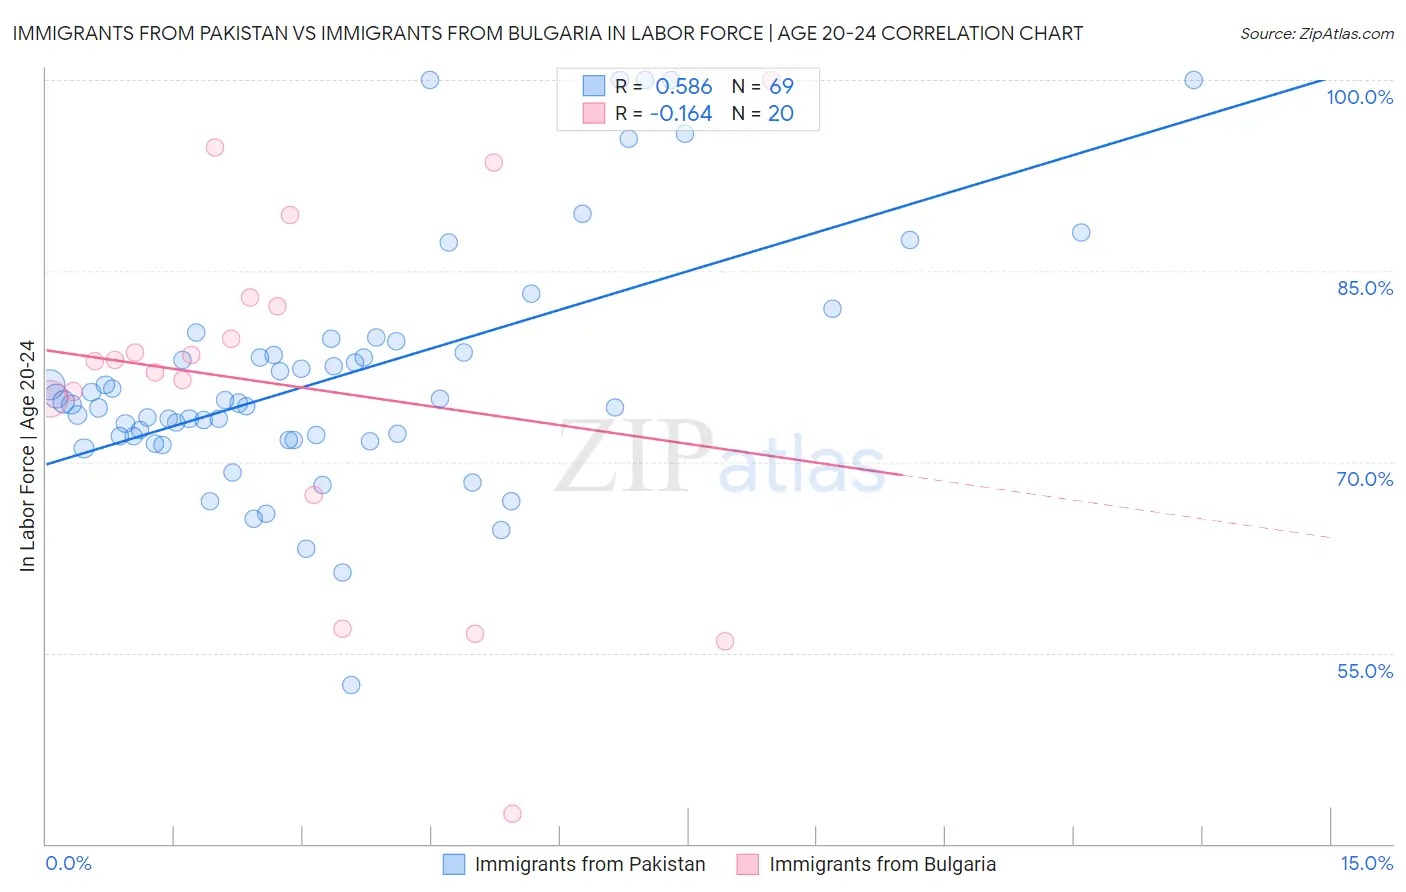
Immigrants from Pakistan vs Immigrants from Bulgaria In Labor Force | Age 20-24 Correlation Chart
The statistical analysis conducted on geographies consisting of 283,855,002 people shows a substantial positive correlation between the proportion of Immigrants from Pakistan and labor force participation rate among population between the ages 20 and 24 in the United States with a correlation coefficient (R) of 0.586 and weighted average of 73.8%. Similarly, the statistical analysis conducted on geographies consisting of 172,510,065 people shows a poor negative correlation between the proportion of Immigrants from Bulgaria and labor force participation rate among population between the ages 20 and 24 in the United States with a correlation coefficient (R) of -0.164 and weighted average of 75.8%, a difference of 2.8%.
In Labor Force | Age 20-24 Correlation Summary
| Measurement | Immigrants from Pakistan | Immigrants from Bulgaria |
| Minimum | 52.5% | 42.4% |
| Maximum | 100.0% | 100.0% |
| Range | 47.5% | 57.6% |
| Mean | 76.7% | 75.9% |
| Median | 74.6% | 77.9% |
| Interquartile 25% (IQ1) | 71.9% | 71.2% |
| Interquartile 75% (IQ3) | 79.0% | 82.6% |
| Interquartile Range (IQR) | 7.2% | 11.4% |
| Standard Deviation (Sample) | 9.6% | 14.3% |
| Standard Deviation (Population) | 9.5% | 13.9% |
Similar Demographics by In Labor Force | Age 20-24
Demographics Similar to Immigrants from Pakistan by In Labor Force | Age 20-24
In terms of in labor force | age 20-24, the demographic groups most similar to Immigrants from Pakistan are Ute (73.8%, a difference of 0.020%), Arapaho (73.8%, a difference of 0.030%), Spanish American Indian (73.7%, a difference of 0.040%), Paraguayan (73.7%, a difference of 0.060%), and Immigrants from Kazakhstan (73.8%, a difference of 0.070%).
| Demographics | Rating | Rank | In Labor Force | Age 20-24 |
| Immigrants | Saudi Arabia | 1.5 /100 | #248 | Tragic 73.9% |
| Blacks/African Americans | 1.3 /100 | #249 | Tragic 73.9% |
| Immigrants | Belgium | 1.3 /100 | #250 | Tragic 73.9% |
| Immigrants | Egypt | 1.2 /100 | #251 | Tragic 73.8% |
| Immigrants | Kazakhstan | 1.1 /100 | #252 | Tragic 73.8% |
| Arapaho | 1.0 /100 | #253 | Tragic 73.8% |
| Ute | 1.0 /100 | #254 | Tragic 73.8% |
| Immigrants | Pakistan | 0.9 /100 | #255 | Tragic 73.8% |
| Spanish American Indians | 0.8 /100 | #256 | Tragic 73.7% |
| Paraguayans | 0.8 /100 | #257 | Tragic 73.7% |
| Egyptians | 0.7 /100 | #258 | Tragic 73.7% |
| Dutch West Indians | 0.7 /100 | #259 | Tragic 73.7% |
| Immigrants | Turkey | 0.7 /100 | #260 | Tragic 73.7% |
| Houma | 0.6 /100 | #261 | Tragic 73.7% |
| Asians | 0.6 /100 | #262 | Tragic 73.7% |
Demographics Similar to Immigrants from Bulgaria by In Labor Force | Age 20-24
In terms of in labor force | age 20-24, the demographic groups most similar to Immigrants from Bulgaria are Pakistani (75.8%, a difference of 0.0%), Immigrants from Serbia (75.8%, a difference of 0.010%), Immigrants from Sierra Leone (75.8%, a difference of 0.020%), Immigrants from Scotland (75.8%, a difference of 0.030%), and Immigrants from Africa (75.8%, a difference of 0.040%).
| Demographics | Rating | Rank | In Labor Force | Age 20-24 |
| Immigrants | North America | 95.0 /100 | #116 | Exceptional 75.9% |
| Assyrians/Chaldeans/Syriacs | 94.9 /100 | #117 | Exceptional 75.9% |
| Spanish Americans | 94.8 /100 | #118 | Exceptional 75.8% |
| Immigrants | Portugal | 94.8 /100 | #119 | Exceptional 75.8% |
| Immigrants | Africa | 94.6 /100 | #120 | Exceptional 75.8% |
| Immigrants | Serbia | 94.3 /100 | #121 | Exceptional 75.8% |
| Pakistanis | 94.1 /100 | #122 | Exceptional 75.8% |
| Immigrants | Bulgaria | 94.1 /100 | #123 | Exceptional 75.8% |
| Immigrants | Sierra Leone | 93.8 /100 | #124 | Exceptional 75.8% |
| Immigrants | Scotland | 93.7 /100 | #125 | Exceptional 75.8% |
| Brazilians | 93.0 /100 | #126 | Exceptional 75.8% |
| Sub-Saharan Africans | 90.9 /100 | #127 | Exceptional 75.7% |
| Immigrants | Afghanistan | 89.4 /100 | #128 | Excellent 75.6% |
| Iroquois | 89.1 /100 | #129 | Excellent 75.6% |
| Immigrants | Austria | 88.8 /100 | #130 | Excellent 75.6% |