Immigrants from Eritrea vs Nepalese Divorced or Separated
COMPARE
Immigrants from Eritrea
Nepalese
Divorced or Separated
Divorced or Separated Comparison
Immigrants from Eritrea
Nepalese
12.1%
DIVORCED OR SEPARATED
31.9/ 100
METRIC RATING
194th/ 347
METRIC RANK
12.5%
DIVORCED OR SEPARATED
1.8/ 100
METRIC RATING
248th/ 347
METRIC RANK
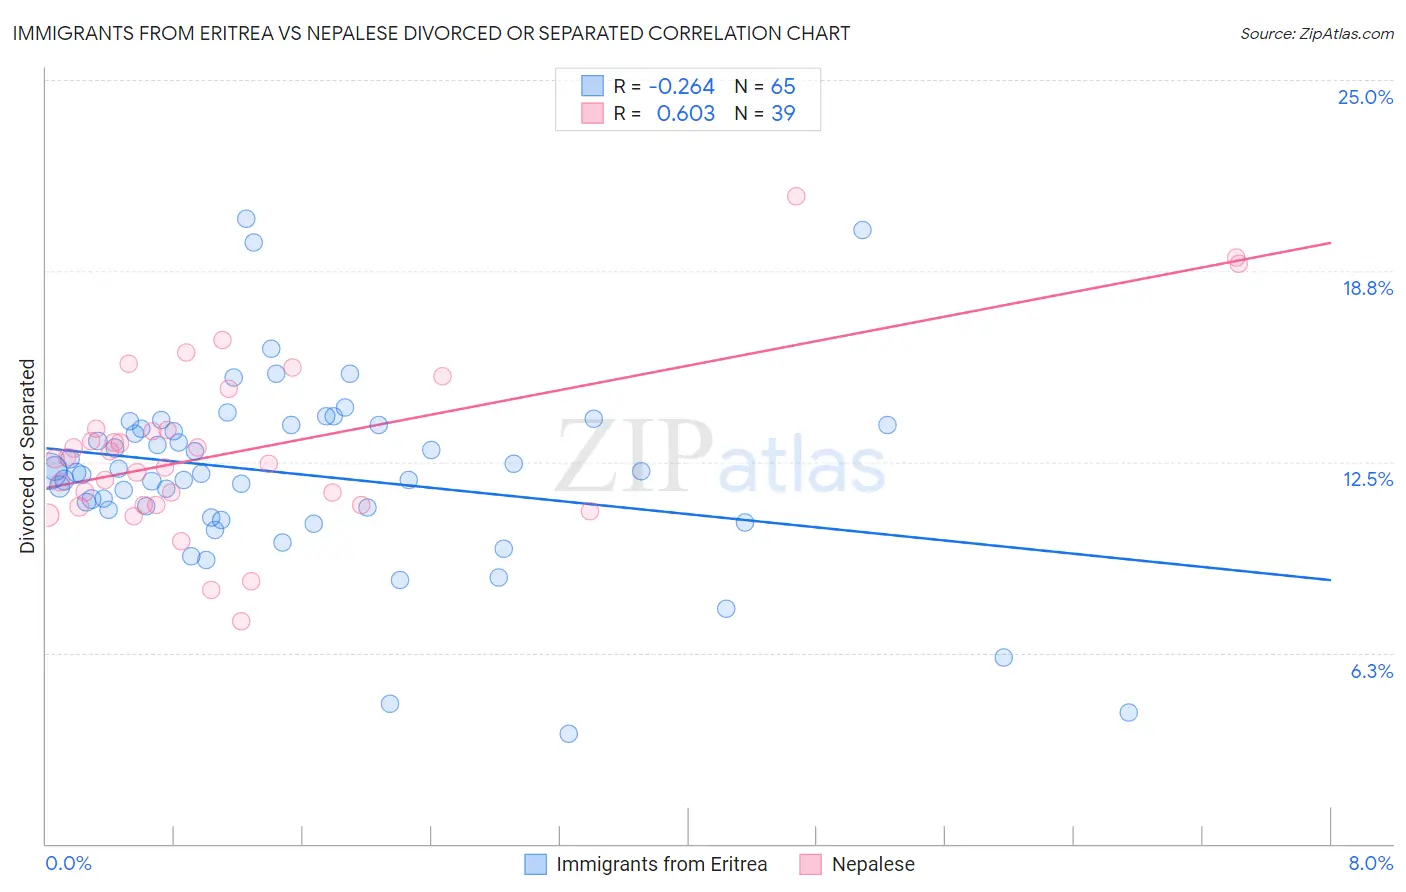
Immigrants from Eritrea vs Nepalese Divorced or Separated Correlation Chart
The statistical analysis conducted on geographies consisting of 104,847,630 people shows a weak negative correlation between the proportion of Immigrants from Eritrea and percentage of population currently divorced or separated in the United States with a correlation coefficient (R) of -0.264 and weighted average of 12.1%. Similarly, the statistical analysis conducted on geographies consisting of 24,519,269 people shows a significant positive correlation between the proportion of Nepalese and percentage of population currently divorced or separated in the United States with a correlation coefficient (R) of 0.603 and weighted average of 12.5%, a difference of 2.8%.
Divorced or Separated Correlation Summary
| Measurement | Immigrants from Eritrea | Nepalese |
| Minimum | 3.6% | 7.3% |
| Maximum | 20.5% | 21.2% |
| Range | 16.9% | 13.9% |
| Mean | 12.1% | 12.9% |
| Median | 12.2% | 12.6% |
| Interquartile 25% (IQ1) | 10.8% | 11.1% |
| Interquartile 75% (IQ3) | 13.7% | 13.6% |
| Interquartile Range (IQR) | 2.9% | 2.5% |
| Standard Deviation (Sample) | 3.1% | 2.9% |
| Standard Deviation (Population) | 3.0% | 2.8% |
Similar Demographics by Divorced or Separated
Demographics Similar to Immigrants from Eritrea by Divorced or Separated
In terms of divorced or separated, the demographic groups most similar to Immigrants from Eritrea are Immigrants from Thailand (12.1%, a difference of 0.020%), Immigrants from England (12.1%, a difference of 0.020%), Norwegian (12.1%, a difference of 0.050%), Immigrants from Burma/Myanmar (12.1%, a difference of 0.060%), and Immigrants from Africa (12.1%, a difference of 0.060%).
| Demographics | Rating | Rank | Divorced or Separated |
| Belizeans | 37.7 /100 | #187 | Fair 12.1% |
| Immigrants | Belize | 37.6 /100 | #188 | Fair 12.1% |
| Sierra Leoneans | 35.5 /100 | #189 | Fair 12.1% |
| Moroccans | 34.8 /100 | #190 | Fair 12.1% |
| Swedes | 34.4 /100 | #191 | Fair 12.1% |
| Norwegians | 33.2 /100 | #192 | Fair 12.1% |
| Immigrants | Thailand | 32.5 /100 | #193 | Fair 12.1% |
| Immigrants | Eritrea | 31.9 /100 | #194 | Fair 12.1% |
| Immigrants | England | 31.4 /100 | #195 | Fair 12.1% |
| Immigrants | Burma/Myanmar | 30.4 /100 | #196 | Fair 12.1% |
| Immigrants | Africa | 30.3 /100 | #197 | Fair 12.1% |
| Nigerians | 30.1 /100 | #198 | Fair 12.1% |
| Central Americans | 29.4 /100 | #199 | Fair 12.1% |
| South Americans | 28.6 /100 | #200 | Fair 12.2% |
| Guatemalans | 26.9 /100 | #201 | Fair 12.2% |
Demographics Similar to Nepalese by Divorced or Separated
In terms of divorced or separated, the demographic groups most similar to Nepalese are Finnish (12.5%, a difference of 0.010%), German (12.5%, a difference of 0.020%), Immigrants from West Indies (12.5%, a difference of 0.060%), Hispanic or Latino (12.5%, a difference of 0.080%), and Irish (12.5%, a difference of 0.29%).
| Demographics | Rating | Rank | Divorced or Separated |
| Uruguayans | 3.4 /100 | #241 | Tragic 12.4% |
| Dutch | 3.1 /100 | #242 | Tragic 12.4% |
| Immigrants | Latin America | 2.8 /100 | #243 | Tragic 12.4% |
| Alaska Natives | 2.5 /100 | #244 | Tragic 12.4% |
| Hispanics or Latinos | 2.0 /100 | #245 | Tragic 12.5% |
| Immigrants | West Indies | 1.9 /100 | #246 | Tragic 12.5% |
| Germans | 1.8 /100 | #247 | Tragic 12.5% |
| Nepalese | 1.8 /100 | #248 | Tragic 12.5% |
| Finns | 1.8 /100 | #249 | Tragic 12.5% |
| Irish | 1.3 /100 | #250 | Tragic 12.5% |
| Aleuts | 1.3 /100 | #251 | Tragic 12.5% |
| Liberians | 0.9 /100 | #252 | Tragic 12.6% |
| Somalis | 0.9 /100 | #253 | Tragic 12.6% |
| Senegalese | 0.8 /100 | #254 | Tragic 12.6% |
| Welsh | 0.7 /100 | #255 | Tragic 12.6% |