Dutch West Indian vs Immigrants from Australia In Labor Force | Age 45-54
COMPARE
Dutch West Indian
Immigrants from Australia
In Labor Force | Age 45-54
In Labor Force | Age 45-54 Comparison
Dutch West Indians
Immigrants from Australia
78.2%
IN LABOR FORCE | AGE 45-54
0.0/ 100
METRIC RATING
324th/ 347
METRIC RANK
82.9%
IN LABOR FORCE | AGE 45-54
68.2/ 100
METRIC RATING
157th/ 347
METRIC RANK
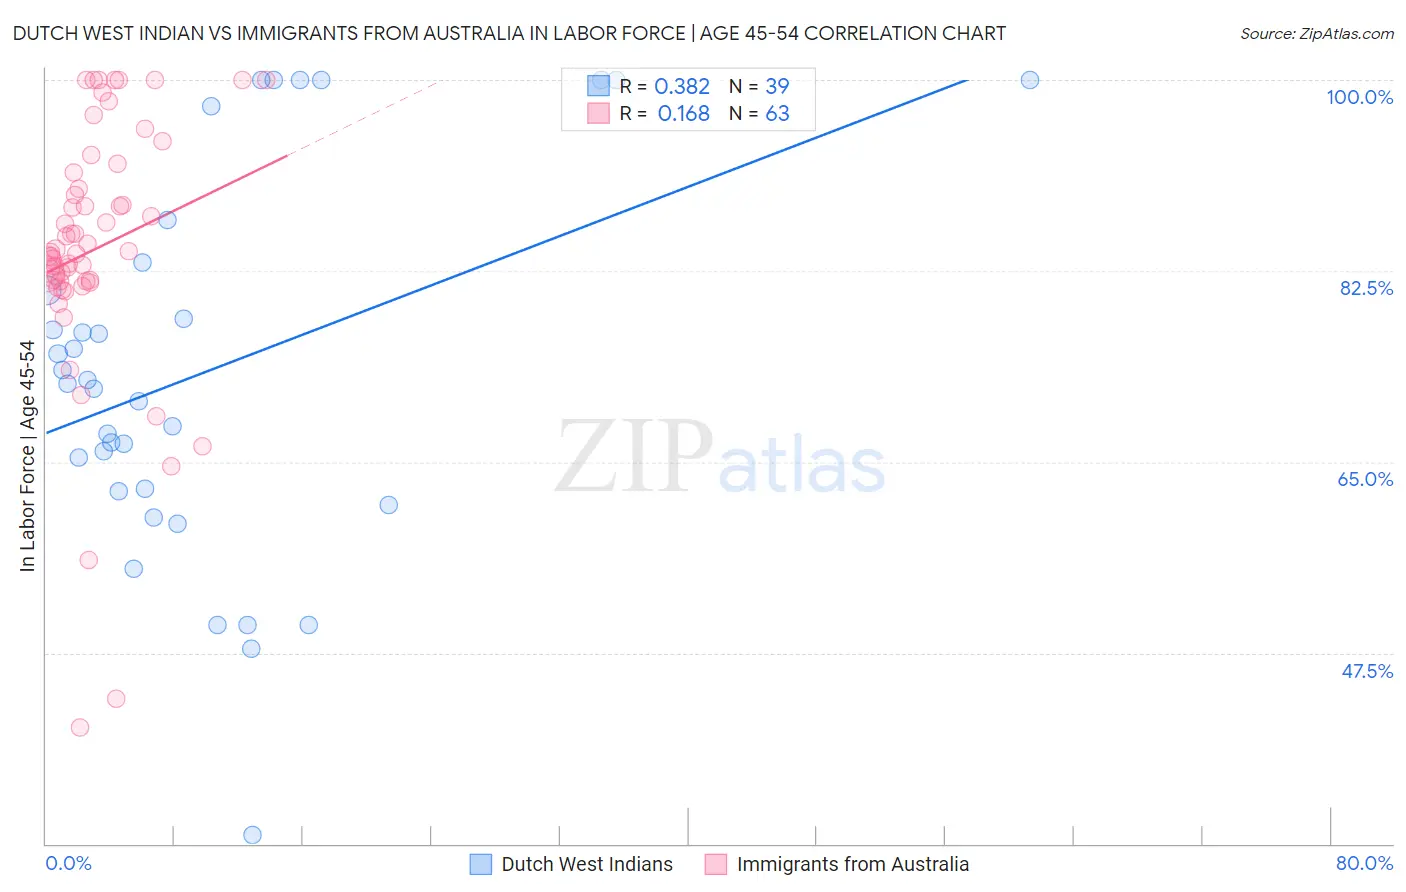
Dutch West Indian vs Immigrants from Australia In Labor Force | Age 45-54 Correlation Chart
The statistical analysis conducted on geographies consisting of 85,763,377 people shows a mild positive correlation between the proportion of Dutch West Indians and labor force participation rate among population between the ages 45 and 54 in the United States with a correlation coefficient (R) of 0.382 and weighted average of 78.2%. Similarly, the statistical analysis conducted on geographies consisting of 227,126,379 people shows a poor positive correlation between the proportion of Immigrants from Australia and labor force participation rate among population between the ages 45 and 54 in the United States with a correlation coefficient (R) of 0.168 and weighted average of 82.9%, a difference of 5.9%.
In Labor Force | Age 45-54 Correlation Summary
| Measurement | Dutch West Indian | Immigrants from Australia |
| Minimum | 30.8% | 40.6% |
| Maximum | 100.0% | 100.0% |
| Range | 69.2% | 59.4% |
| Mean | 73.3% | 84.5% |
| Median | 72.2% | 84.2% |
| Interquartile 25% (IQ1) | 62.3% | 81.6% |
| Interquartile 75% (IQ3) | 83.3% | 91.5% |
| Interquartile Range (IQR) | 21.0% | 9.9% |
| Standard Deviation (Sample) | 17.4% | 12.0% |
| Standard Deviation (Population) | 17.1% | 11.9% |
Similar Demographics by In Labor Force | Age 45-54
Demographics Similar to Dutch West Indians by In Labor Force | Age 45-54
In terms of in labor force | age 45-54, the demographic groups most similar to Dutch West Indians are Kiowa (78.3%, a difference of 0.020%), Choctaw (78.2%, a difference of 0.090%), Crow (78.3%, a difference of 0.10%), Seminole (78.1%, a difference of 0.14%), and Cajun (78.1%, a difference of 0.15%).
| Demographics | Rating | Rank | In Labor Force | Age 45-54 |
| Comanche | 0.0 /100 | #317 | Tragic 79.2% |
| Chickasaw | 0.0 /100 | #318 | Tragic 79.0% |
| Cherokee | 0.0 /100 | #319 | Tragic 79.0% |
| Yaqui | 0.0 /100 | #320 | Tragic 78.9% |
| Yup'ik | 0.0 /100 | #321 | Tragic 78.6% |
| Crow | 0.0 /100 | #322 | Tragic 78.3% |
| Kiowa | 0.0 /100 | #323 | Tragic 78.3% |
| Dutch West Indians | 0.0 /100 | #324 | Tragic 78.2% |
| Choctaw | 0.0 /100 | #325 | Tragic 78.2% |
| Seminole | 0.0 /100 | #326 | Tragic 78.1% |
| Cajuns | 0.0 /100 | #327 | Tragic 78.1% |
| Sioux | 0.0 /100 | #328 | Tragic 78.0% |
| Creek | 0.0 /100 | #329 | Tragic 77.7% |
| Cheyenne | 0.0 /100 | #330 | Tragic 77.6% |
| Tsimshian | 0.0 /100 | #331 | Tragic 77.4% |
Demographics Similar to Immigrants from Australia by In Labor Force | Age 45-54
In terms of in labor force | age 45-54, the demographic groups most similar to Immigrants from Australia are Immigrants from Southern Europe (82.9%, a difference of 0.0%), Immigrants from Philippines (82.9%, a difference of 0.010%), Immigrants from Saudi Arabia (82.9%, a difference of 0.010%), Immigrants from Indonesia (82.9%, a difference of 0.020%), and Immigrants from Ghana (82.9%, a difference of 0.020%).
| Demographics | Rating | Rank | In Labor Force | Age 45-54 |
| Immigrants | Netherlands | 72.6 /100 | #150 | Good 82.9% |
| Koreans | 71.9 /100 | #151 | Good 82.9% |
| Slavs | 71.5 /100 | #152 | Good 82.9% |
| Immigrants | Indonesia | 70.6 /100 | #153 | Good 82.9% |
| Immigrants | Ghana | 70.3 /100 | #154 | Good 82.9% |
| Immigrants | Philippines | 69.0 /100 | #155 | Good 82.9% |
| Immigrants | Saudi Arabia | 68.8 /100 | #156 | Good 82.9% |
| Immigrants | Australia | 68.2 /100 | #157 | Good 82.9% |
| Immigrants | Southern Europe | 67.8 /100 | #158 | Good 82.9% |
| Immigrants | Austria | 64.6 /100 | #159 | Good 82.9% |
| Laotians | 62.8 /100 | #160 | Good 82.9% |
| South American Indians | 62.2 /100 | #161 | Good 82.9% |
| Haitians | 61.8 /100 | #162 | Good 82.8% |
| Dutch | 61.7 /100 | #163 | Good 82.8% |
| German Russians | 61.3 /100 | #164 | Good 82.8% |