Immigrants from Eritrea vs Cheyenne In Labor Force | Age 45-54
COMPARE
Immigrants from Eritrea
Cheyenne
In Labor Force | Age 45-54
In Labor Force | Age 45-54 Comparison
Immigrants from Eritrea
Cheyenne
83.8%
IN LABOR FORCE | AGE 45-54
99.7/ 100
METRIC RATING
31st/ 347
METRIC RANK
77.6%
IN LABOR FORCE | AGE 45-54
0.0/ 100
METRIC RATING
330th/ 347
METRIC RANK
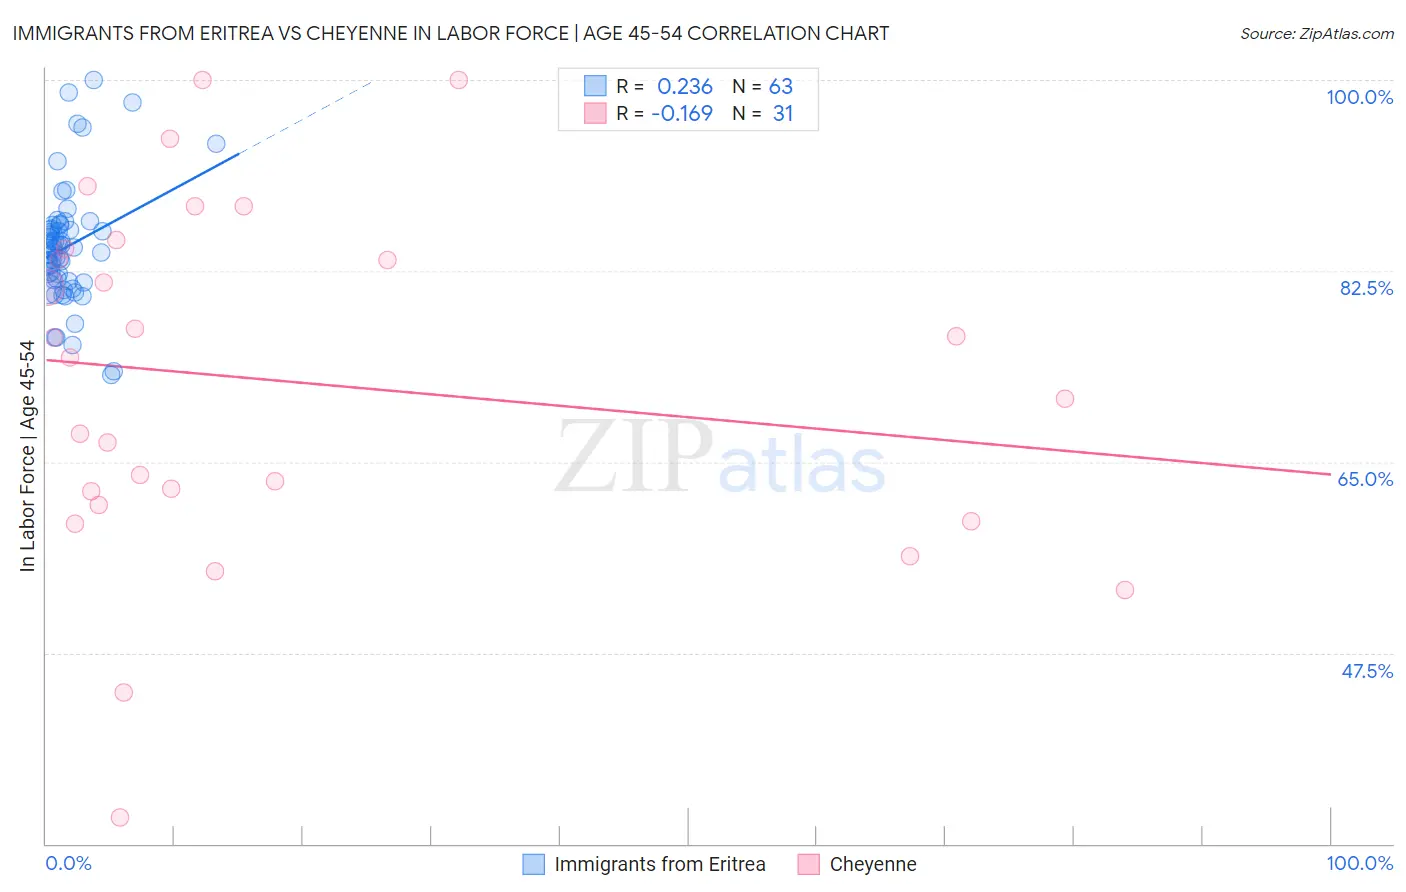
Immigrants from Eritrea vs Cheyenne In Labor Force | Age 45-54 Correlation Chart
The statistical analysis conducted on geographies consisting of 104,844,448 people shows a weak positive correlation between the proportion of Immigrants from Eritrea and labor force participation rate among population between the ages 45 and 54 in the United States with a correlation coefficient (R) of 0.236 and weighted average of 83.8%. Similarly, the statistical analysis conducted on geographies consisting of 80,704,185 people shows a poor negative correlation between the proportion of Cheyenne and labor force participation rate among population between the ages 45 and 54 in the United States with a correlation coefficient (R) of -0.169 and weighted average of 77.6%, a difference of 8.1%.
In Labor Force | Age 45-54 Correlation Summary
| Measurement | Immigrants from Eritrea | Cheyenne |
| Minimum | 73.0% | 32.4% |
| Maximum | 100.0% | 100.0% |
| Range | 27.0% | 67.6% |
| Mean | 84.7% | 72.4% |
| Median | 84.6% | 74.5% |
| Interquartile 25% (IQ1) | 81.5% | 61.0% |
| Interquartile 75% (IQ3) | 86.7% | 84.5% |
| Interquartile Range (IQR) | 5.2% | 23.5% |
| Standard Deviation (Sample) | 5.5% | 16.2% |
| Standard Deviation (Population) | 5.4% | 15.9% |
Similar Demographics by In Labor Force | Age 45-54
Demographics Similar to Immigrants from Eritrea by In Labor Force | Age 45-54
In terms of in labor force | age 45-54, the demographic groups most similar to Immigrants from Eritrea are Immigrants from Bulgaria (83.8%, a difference of 0.020%), Turkish (83.8%, a difference of 0.020%), Latvian (83.8%, a difference of 0.020%), Immigrants from Pakistan (83.8%, a difference of 0.050%), and Immigrants from Lithuania (83.9%, a difference of 0.070%).
| Demographics | Rating | Rank | In Labor Force | Age 45-54 |
| Slovenes | 99.8 /100 | #24 | Exceptional 83.9% |
| Immigrants | North Macedonia | 99.8 /100 | #25 | Exceptional 83.9% |
| Immigrants | Serbia | 99.8 /100 | #26 | Exceptional 83.9% |
| Immigrants | Brazil | 99.8 /100 | #27 | Exceptional 83.9% |
| Immigrants | Lithuania | 99.8 /100 | #28 | Exceptional 83.9% |
| Immigrants | Pakistan | 99.7 /100 | #29 | Exceptional 83.8% |
| Immigrants | Bulgaria | 99.7 /100 | #30 | Exceptional 83.8% |
| Immigrants | Eritrea | 99.7 /100 | #31 | Exceptional 83.8% |
| Turks | 99.7 /100 | #32 | Exceptional 83.8% |
| Latvians | 99.7 /100 | #33 | Exceptional 83.8% |
| Kenyans | 99.5 /100 | #34 | Exceptional 83.7% |
| Brazilians | 99.5 /100 | #35 | Exceptional 83.7% |
| Ugandans | 99.5 /100 | #36 | Exceptional 83.7% |
| Swedes | 99.4 /100 | #37 | Exceptional 83.7% |
| Immigrants | Venezuela | 99.4 /100 | #38 | Exceptional 83.7% |
Demographics Similar to Cheyenne by In Labor Force | Age 45-54
In terms of in labor force | age 45-54, the demographic groups most similar to Cheyenne are Tsimshian (77.4%, a difference of 0.15%), Menominee (77.4%, a difference of 0.18%), Creek (77.7%, a difference of 0.22%), Sioux (78.0%, a difference of 0.52%), and Native/Alaskan (77.1%, a difference of 0.54%).
| Demographics | Rating | Rank | In Labor Force | Age 45-54 |
| Kiowa | 0.0 /100 | #323 | Tragic 78.3% |
| Dutch West Indians | 0.0 /100 | #324 | Tragic 78.2% |
| Choctaw | 0.0 /100 | #325 | Tragic 78.2% |
| Seminole | 0.0 /100 | #326 | Tragic 78.1% |
| Cajuns | 0.0 /100 | #327 | Tragic 78.1% |
| Sioux | 0.0 /100 | #328 | Tragic 78.0% |
| Creek | 0.0 /100 | #329 | Tragic 77.7% |
| Cheyenne | 0.0 /100 | #330 | Tragic 77.6% |
| Tsimshian | 0.0 /100 | #331 | Tragic 77.4% |
| Menominee | 0.0 /100 | #332 | Tragic 77.4% |
| Natives/Alaskans | 0.0 /100 | #333 | Tragic 77.1% |
| Apache | 0.0 /100 | #334 | Tragic 77.1% |
| Arapaho | 0.0 /100 | #335 | Tragic 77.1% |
| Paiute | 0.0 /100 | #336 | Tragic 76.7% |
| Ute | 0.0 /100 | #337 | Tragic 76.6% |