Scotch-Irish vs Immigrants from Australia In Labor Force | Age 45-54
COMPARE
Scotch-Irish
Immigrants from Australia
In Labor Force | Age 45-54
In Labor Force | Age 45-54 Comparison
Scotch-Irish
Immigrants from Australia
81.6%
IN LABOR FORCE | AGE 45-54
0.2/ 100
METRIC RATING
255th/ 347
METRIC RANK
82.9%
IN LABOR FORCE | AGE 45-54
68.2/ 100
METRIC RATING
157th/ 347
METRIC RANK
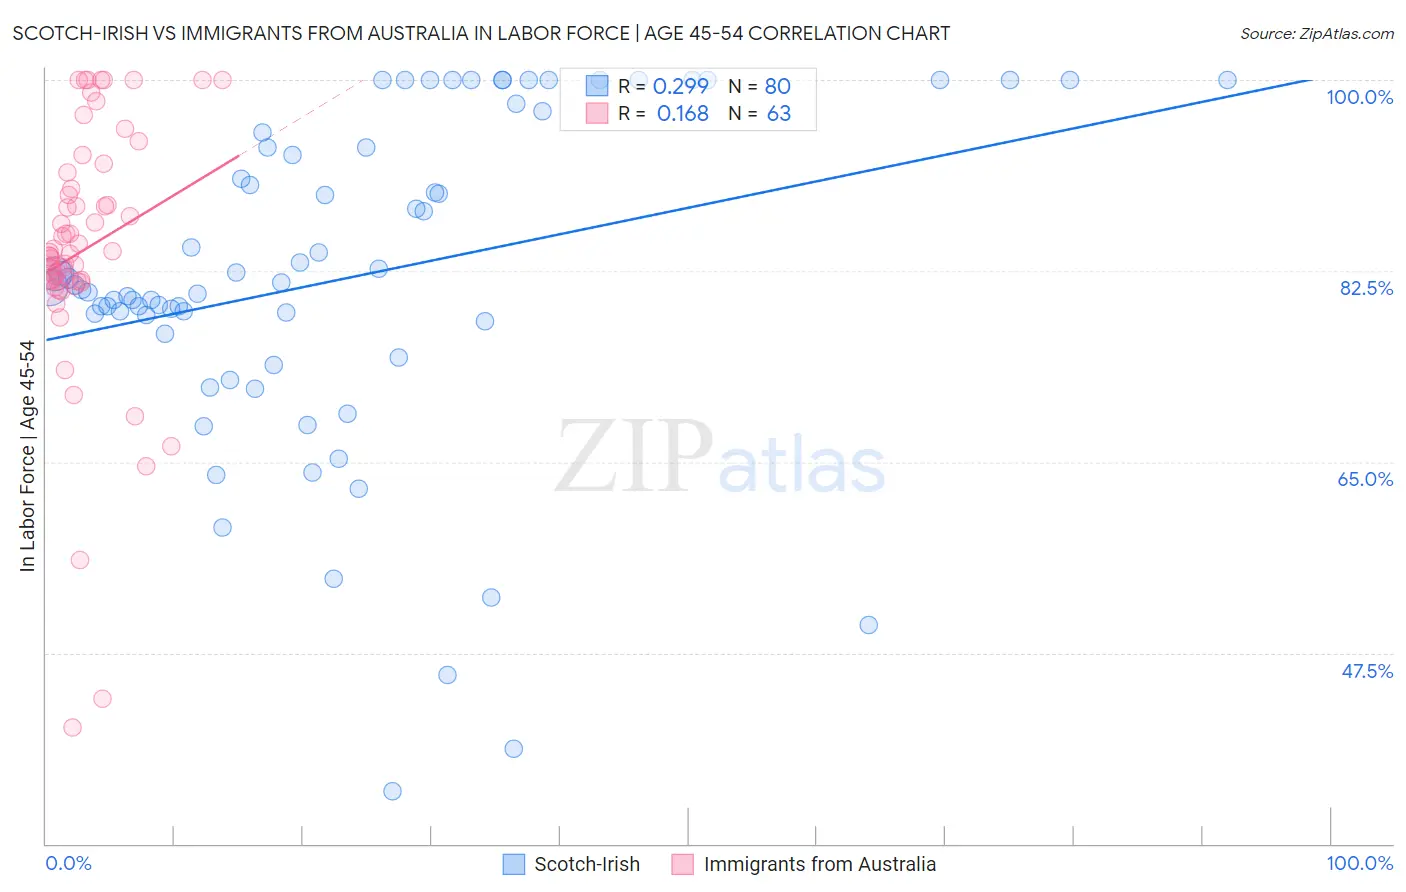
Scotch-Irish vs Immigrants from Australia In Labor Force | Age 45-54 Correlation Chart
The statistical analysis conducted on geographies consisting of 548,273,323 people shows a weak positive correlation between the proportion of Scotch-Irish and labor force participation rate among population between the ages 45 and 54 in the United States with a correlation coefficient (R) of 0.299 and weighted average of 81.6%. Similarly, the statistical analysis conducted on geographies consisting of 227,126,379 people shows a poor positive correlation between the proportion of Immigrants from Australia and labor force participation rate among population between the ages 45 and 54 in the United States with a correlation coefficient (R) of 0.168 and weighted average of 82.9%, a difference of 1.6%.
In Labor Force | Age 45-54 Correlation Summary
| Measurement | Scotch-Irish | Immigrants from Australia |
| Minimum | 34.8% | 40.6% |
| Maximum | 100.0% | 100.0% |
| Range | 65.2% | 59.4% |
| Mean | 81.9% | 84.5% |
| Median | 81.1% | 84.2% |
| Interquartile 25% (IQ1) | 77.3% | 81.6% |
| Interquartile 75% (IQ3) | 94.5% | 91.5% |
| Interquartile Range (IQR) | 17.2% | 9.9% |
| Standard Deviation (Sample) | 15.1% | 12.0% |
| Standard Deviation (Population) | 15.0% | 11.9% |
Similar Demographics by In Labor Force | Age 45-54
Demographics Similar to Scotch-Irish by In Labor Force | Age 45-54
In terms of in labor force | age 45-54, the demographic groups most similar to Scotch-Irish are Japanese (81.6%, a difference of 0.020%), Immigrants from Laos (81.6%, a difference of 0.020%), Barbadian (81.6%, a difference of 0.030%), Pennsylvania German (81.6%, a difference of 0.050%), and Immigrants from Congo (81.6%, a difference of 0.050%).
| Demographics | Rating | Rank | In Labor Force | Age 45-54 |
| Puget Sound Salish | 0.3 /100 | #248 | Tragic 81.7% |
| Hmong | 0.3 /100 | #249 | Tragic 81.7% |
| Immigrants | Armenia | 0.2 /100 | #250 | Tragic 81.7% |
| Guamanians/Chamorros | 0.2 /100 | #251 | Tragic 81.6% |
| Pennsylvania Germans | 0.2 /100 | #252 | Tragic 81.6% |
| Japanese | 0.2 /100 | #253 | Tragic 81.6% |
| Immigrants | Laos | 0.2 /100 | #254 | Tragic 81.6% |
| Scotch-Irish | 0.2 /100 | #255 | Tragic 81.6% |
| Barbadians | 0.1 /100 | #256 | Tragic 81.6% |
| Immigrants | Congo | 0.1 /100 | #257 | Tragic 81.6% |
| Immigrants | Fiji | 0.1 /100 | #258 | Tragic 81.5% |
| Guyanese | 0.1 /100 | #259 | Tragic 81.5% |
| Spaniards | 0.1 /100 | #260 | Tragic 81.5% |
| Hawaiians | 0.1 /100 | #261 | Tragic 81.5% |
| Immigrants | Guyana | 0.1 /100 | #262 | Tragic 81.5% |
Demographics Similar to Immigrants from Australia by In Labor Force | Age 45-54
In terms of in labor force | age 45-54, the demographic groups most similar to Immigrants from Australia are Immigrants from Southern Europe (82.9%, a difference of 0.0%), Immigrants from Philippines (82.9%, a difference of 0.010%), Immigrants from Saudi Arabia (82.9%, a difference of 0.010%), Immigrants from Indonesia (82.9%, a difference of 0.020%), and Immigrants from Ghana (82.9%, a difference of 0.020%).
| Demographics | Rating | Rank | In Labor Force | Age 45-54 |
| Immigrants | Netherlands | 72.6 /100 | #150 | Good 82.9% |
| Koreans | 71.9 /100 | #151 | Good 82.9% |
| Slavs | 71.5 /100 | #152 | Good 82.9% |
| Immigrants | Indonesia | 70.6 /100 | #153 | Good 82.9% |
| Immigrants | Ghana | 70.3 /100 | #154 | Good 82.9% |
| Immigrants | Philippines | 69.0 /100 | #155 | Good 82.9% |
| Immigrants | Saudi Arabia | 68.8 /100 | #156 | Good 82.9% |
| Immigrants | Australia | 68.2 /100 | #157 | Good 82.9% |
| Immigrants | Southern Europe | 67.8 /100 | #158 | Good 82.9% |
| Immigrants | Austria | 64.6 /100 | #159 | Good 82.9% |
| Laotians | 62.8 /100 | #160 | Good 82.9% |
| South American Indians | 62.2 /100 | #161 | Good 82.9% |
| Haitians | 61.8 /100 | #162 | Good 82.8% |
| Dutch | 61.7 /100 | #163 | Good 82.8% |
| German Russians | 61.3 /100 | #164 | Good 82.8% |