Immigrants from St. Vincent and the Grenadines vs Cherokee In Labor Force | Age 16-19
COMPARE
Immigrants from St. Vincent and the Grenadines
Cherokee
In Labor Force | Age 16-19
In Labor Force | Age 16-19 Comparison
Immigrants from St. Vincent and the Grenadines
Cherokee
26.3%
IN LABOR FORCE | AGE 16-19
0.0/ 100
METRIC RATING
346th/ 347
METRIC RANK
40.2%
IN LABOR FORCE | AGE 16-19
100.0/ 100
METRIC RATING
62nd/ 347
METRIC RANK
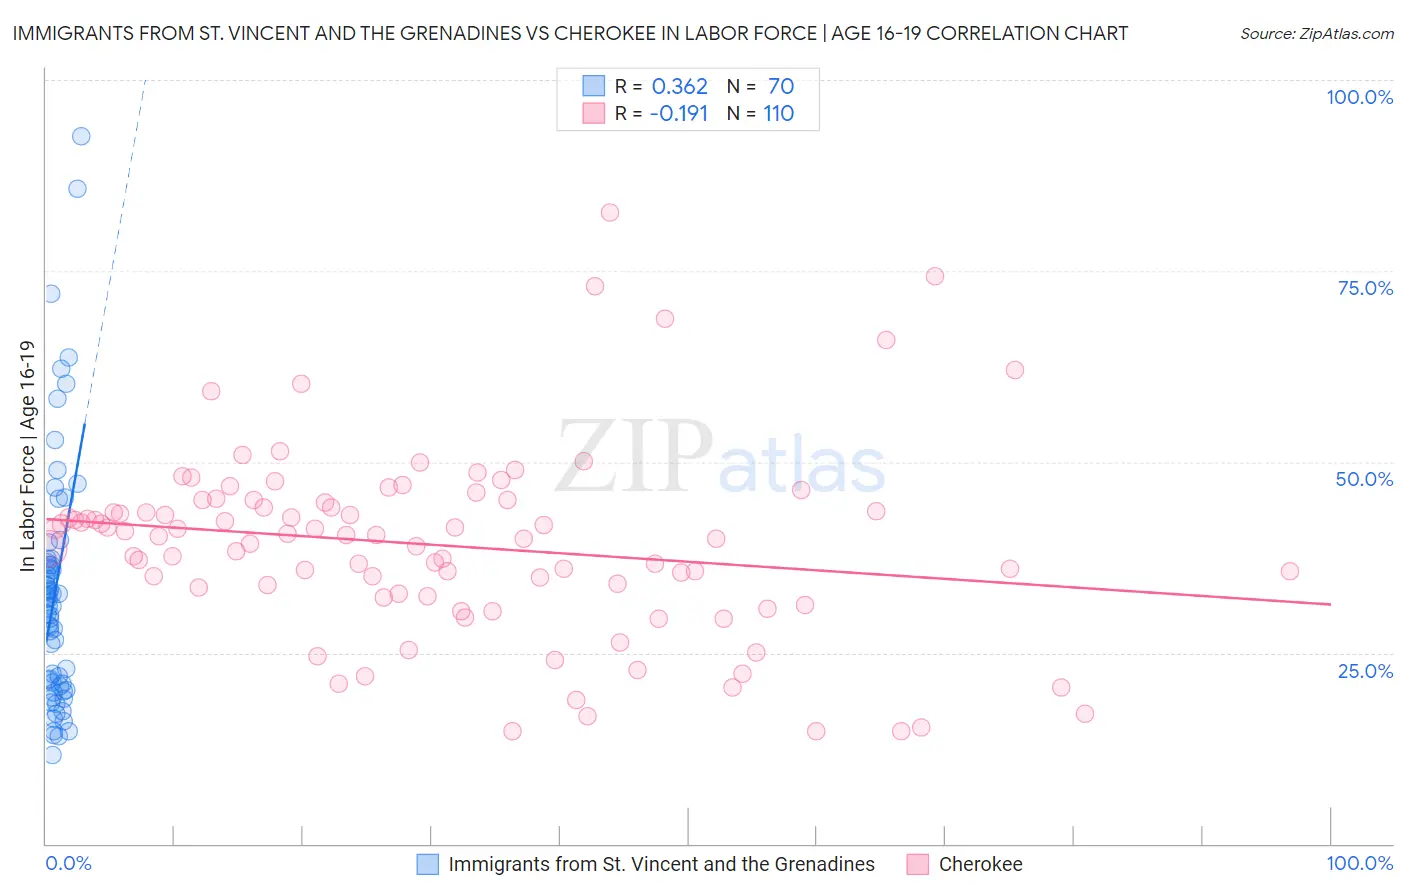
Immigrants from St. Vincent and the Grenadines vs Cherokee In Labor Force | Age 16-19 Correlation Chart
The statistical analysis conducted on geographies consisting of 56,187,871 people shows a mild positive correlation between the proportion of Immigrants from St. Vincent and the Grenadines and labor force participation rate among population between the ages 16 and 19 in the United States with a correlation coefficient (R) of 0.362 and weighted average of 26.3%. Similarly, the statistical analysis conducted on geographies consisting of 492,065,053 people shows a poor negative correlation between the proportion of Cherokee and labor force participation rate among population between the ages 16 and 19 in the United States with a correlation coefficient (R) of -0.191 and weighted average of 40.2%, a difference of 53.3%.
In Labor Force | Age 16-19 Correlation Summary
| Measurement | Immigrants from St. Vincent and the Grenadines | Cherokee |
| Minimum | 11.7% | 14.7% |
| Maximum | 92.7% | 82.7% |
| Range | 81.0% | 68.0% |
| Mean | 33.1% | 39.1% |
| Median | 31.6% | 40.3% |
| Interquartile 25% (IQ1) | 20.9% | 32.8% |
| Interquartile 75% (IQ3) | 36.9% | 44.6% |
| Interquartile Range (IQR) | 16.0% | 11.9% |
| Standard Deviation (Sample) | 16.2% | 12.3% |
| Standard Deviation (Population) | 16.1% | 12.3% |
Similar Demographics by In Labor Force | Age 16-19
Demographics Similar to Immigrants from St. Vincent and the Grenadines by In Labor Force | Age 16-19
In terms of in labor force | age 16-19, the demographic groups most similar to Immigrants from St. Vincent and the Grenadines are Immigrants from Grenada (25.4%, a difference of 3.4%), Immigrants from Guyana (27.3%, a difference of 3.9%), Guyanese (27.4%, a difference of 4.5%), Yuman (27.7%, a difference of 5.3%), and Immigrants from Barbados (29.0%, a difference of 10.4%).
| Demographics | Rating | Rank | In Labor Force | Age 16-19 |
| Immigrants | Hong Kong | 0.0 /100 | #333 | Tragic 30.5% |
| Puerto Ricans | 0.0 /100 | #334 | Tragic 30.3% |
| Immigrants | Cuba | 0.0 /100 | #335 | Tragic 30.2% |
| Immigrants | Trinidad and Tobago | 0.0 /100 | #336 | Tragic 30.2% |
| Immigrants | Bangladesh | 0.0 /100 | #337 | Tragic 30.0% |
| Vietnamese | 0.0 /100 | #338 | Tragic 29.6% |
| Immigrants | Uzbekistan | 0.0 /100 | #339 | Tragic 29.2% |
| British West Indians | 0.0 /100 | #340 | Tragic 29.1% |
| Immigrants | Armenia | 0.0 /100 | #341 | Tragic 29.0% |
| Immigrants | Barbados | 0.0 /100 | #342 | Tragic 29.0% |
| Yuman | 0.0 /100 | #343 | Tragic 27.7% |
| Guyanese | 0.0 /100 | #344 | Tragic 27.4% |
| Immigrants | Guyana | 0.0 /100 | #345 | Tragic 27.3% |
| Immigrants | St. Vincent and the Grenadines | 0.0 /100 | #346 | Tragic 26.3% |
| Immigrants | Grenada | 0.0 /100 | #347 | Tragic 25.4% |
Demographics Similar to Cherokee by In Labor Force | Age 16-19
In terms of in labor force | age 16-19, the demographic groups most similar to Cherokee are Northern European (40.2%, a difference of 0.060%), American (40.3%, a difference of 0.14%), Immigrants from Micronesia (40.2%, a difference of 0.17%), Kenyan (40.1%, a difference of 0.25%), and Immigrants from Eastern Africa (40.4%, a difference of 0.29%).
| Demographics | Rating | Rank | In Labor Force | Age 16-19 |
| British | 100.0 /100 | #55 | Exceptional 40.5% |
| Fijians | 100.0 /100 | #56 | Exceptional 40.4% |
| Lithuanians | 100.0 /100 | #57 | Exceptional 40.4% |
| Aleuts | 100.0 /100 | #58 | Exceptional 40.4% |
| Slavs | 100.0 /100 | #59 | Exceptional 40.4% |
| Immigrants | Eastern Africa | 100.0 /100 | #60 | Exceptional 40.4% |
| Americans | 100.0 /100 | #61 | Exceptional 40.3% |
| Cherokee | 100.0 /100 | #62 | Exceptional 40.2% |
| Northern Europeans | 100.0 /100 | #63 | Exceptional 40.2% |
| Immigrants | Micronesia | 100.0 /100 | #64 | Exceptional 40.2% |
| Kenyans | 100.0 /100 | #65 | Exceptional 40.1% |
| Immigrants | Nonimmigrants | 100.0 /100 | #66 | Exceptional 40.1% |
| Canadians | 100.0 /100 | #67 | Exceptional 40.1% |
| Italians | 99.9 /100 | #68 | Exceptional 40.1% |
| Potawatomi | 99.9 /100 | #69 | Exceptional 40.0% |