Immigrants from Eritrea vs Cherokee No Vehicles in Household
COMPARE
Immigrants from Eritrea
Cherokee
No Vehicles in Household
No Vehicles in Household Comparison
Immigrants from Eritrea
Cherokee
10.6%
NO VEHICLES IN HOUSEHOLD
36.3/ 100
METRIC RATING
189th/ 347
METRIC RANK
7.7%
NO VEHICLES IN HOUSEHOLD
99.9/ 100
METRIC RATING
35th/ 347
METRIC RANK
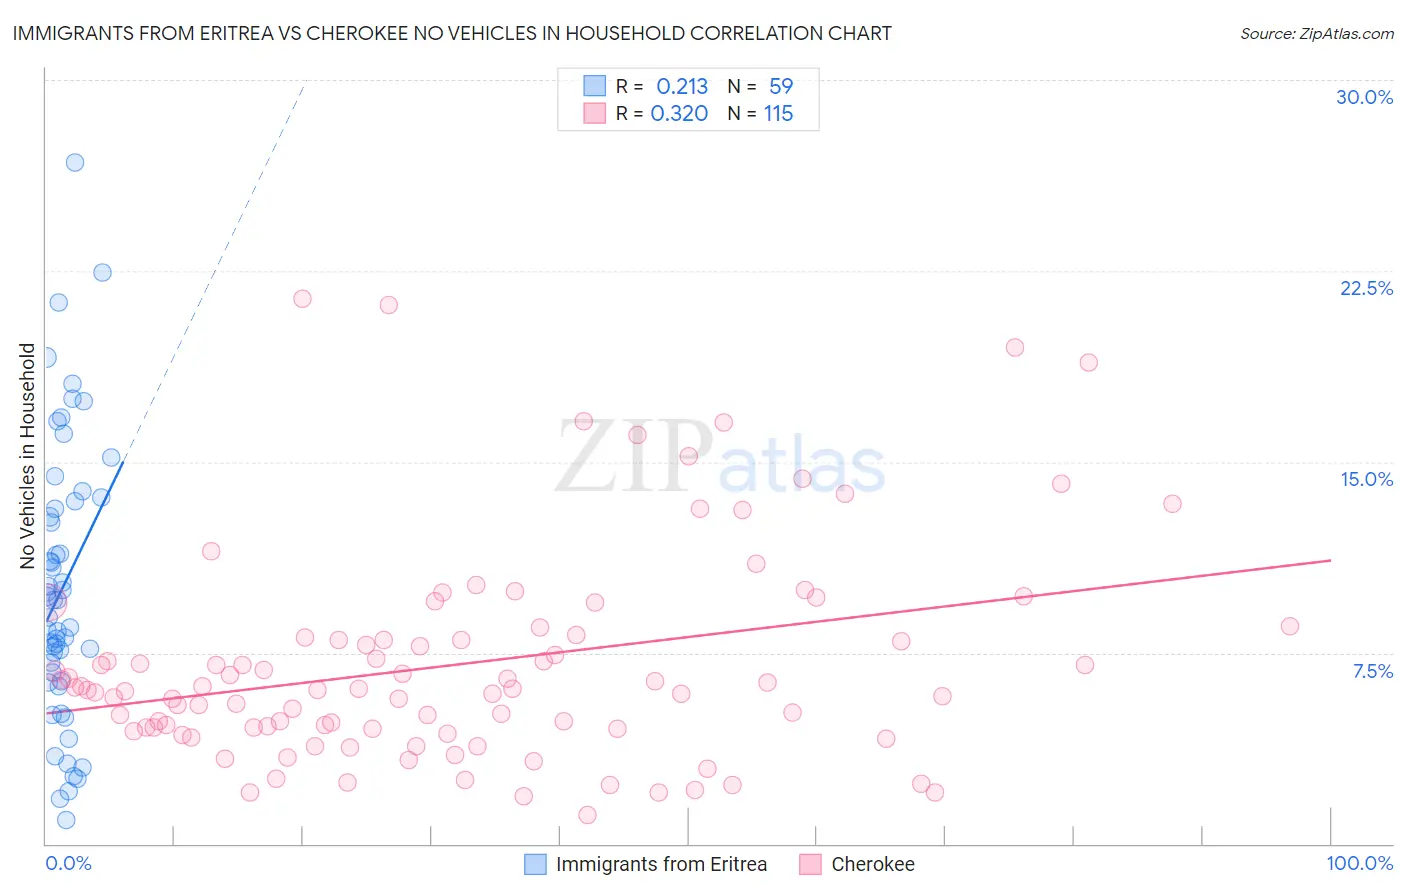
Immigrants from Eritrea vs Cherokee No Vehicles in Household Correlation Chart
The statistical analysis conducted on geographies consisting of 104,832,678 people shows a weak positive correlation between the proportion of Immigrants from Eritrea and percentage of households with no vehicle available in the United States with a correlation coefficient (R) of 0.213 and weighted average of 10.6%. Similarly, the statistical analysis conducted on geographies consisting of 491,425,453 people shows a mild positive correlation between the proportion of Cherokee and percentage of households with no vehicle available in the United States with a correlation coefficient (R) of 0.320 and weighted average of 7.7%, a difference of 37.0%.
No Vehicles in Household Correlation Summary
| Measurement | Immigrants from Eritrea | Cherokee |
| Minimum | 0.94% | 1.1% |
| Maximum | 26.8% | 21.4% |
| Range | 25.8% | 20.3% |
| Mean | 10.1% | 7.1% |
| Median | 9.6% | 6.1% |
| Interquartile 25% (IQ1) | 6.4% | 4.5% |
| Interquartile 75% (IQ3) | 13.4% | 8.1% |
| Interquartile Range (IQR) | 7.1% | 3.5% |
| Standard Deviation (Sample) | 5.5% | 4.2% |
| Standard Deviation (Population) | 5.4% | 4.1% |
Similar Demographics by No Vehicles in Household
Demographics Similar to Immigrants from Eritrea by No Vehicles in Household
In terms of no vehicles in household, the demographic groups most similar to Immigrants from Eritrea are Immigrants from Armenia (10.6%, a difference of 0.18%), Immigrants from North Macedonia (10.6%, a difference of 0.23%), Immigrants from Poland (10.6%, a difference of 0.30%), Immigrants from Northern Europe (10.7%, a difference of 0.47%), and Carpatho Rusyn (10.7%, a difference of 0.61%).
| Demographics | Rating | Rank | No Vehicles in Household |
| Immigrants | Bulgaria | 43.8 /100 | #182 | Average 10.5% |
| Natives/Alaskans | 43.7 /100 | #183 | Average 10.5% |
| Immigrants | Nepal | 42.4 /100 | #184 | Average 10.5% |
| South Americans | 41.9 /100 | #185 | Average 10.5% |
| German Russians | 40.6 /100 | #186 | Average 10.5% |
| Immigrants | Poland | 38.4 /100 | #187 | Fair 10.6% |
| Immigrants | Armenia | 37.5 /100 | #188 | Fair 10.6% |
| Immigrants | Eritrea | 36.3 /100 | #189 | Fair 10.6% |
| Immigrants | North Macedonia | 34.6 /100 | #190 | Fair 10.6% |
| Immigrants | Northern Europe | 33.1 /100 | #191 | Fair 10.7% |
| Carpatho Rusyns | 32.1 /100 | #192 | Fair 10.7% |
| Ukrainians | 28.0 /100 | #193 | Fair 10.7% |
| Pueblo | 27.0 /100 | #194 | Fair 10.8% |
| Immigrants | Brazil | 26.3 /100 | #195 | Fair 10.8% |
| Central Americans | 24.3 /100 | #196 | Fair 10.8% |
Demographics Similar to Cherokee by No Vehicles in Household
In terms of no vehicles in household, the demographic groups most similar to Cherokee are Iraqi (7.7%, a difference of 0.13%), Immigrants from Vietnam (7.7%, a difference of 0.14%), Immigrants from Taiwan (7.7%, a difference of 0.27%), Malaysian (7.7%, a difference of 0.38%), and Basque (7.8%, a difference of 0.39%).
| Demographics | Rating | Rank | No Vehicles in Household |
| Samoans | 100.0 /100 | #28 | Exceptional 7.6% |
| Americans | 100.0 /100 | #29 | Exceptional 7.7% |
| Finns | 100.0 /100 | #30 | Exceptional 7.7% |
| Native Hawaiians | 100.0 /100 | #31 | Exceptional 7.7% |
| Malaysians | 100.0 /100 | #32 | Exceptional 7.7% |
| Immigrants | Taiwan | 100.0 /100 | #33 | Exceptional 7.7% |
| Immigrants | Vietnam | 100.0 /100 | #34 | Exceptional 7.7% |
| Cherokee | 99.9 /100 | #35 | Exceptional 7.7% |
| Iraqis | 99.9 /100 | #36 | Exceptional 7.7% |
| Basques | 99.9 /100 | #37 | Exceptional 7.8% |
| Creek | 99.9 /100 | #38 | Exceptional 7.8% |
| Immigrants | Fiji | 99.9 /100 | #39 | Exceptional 7.8% |
| Czechoslovakians | 99.9 /100 | #40 | Exceptional 7.8% |
| French Canadians | 99.9 /100 | #41 | Exceptional 7.8% |
| Swiss | 99.9 /100 | #42 | Exceptional 7.9% |