Immigrants from England vs Immigrants from Western Asia 11th Grade
COMPARE
Immigrants from England
Immigrants from Western Asia
11th Grade
11th Grade Comparison
Immigrants from England
Immigrants from Western Asia
93.8%
11TH GRADE
99.7/ 100
METRIC RATING
70th/ 347
METRIC RANK
92.4%
11TH GRADE
35.0/ 100
METRIC RATING
187th/ 347
METRIC RANK
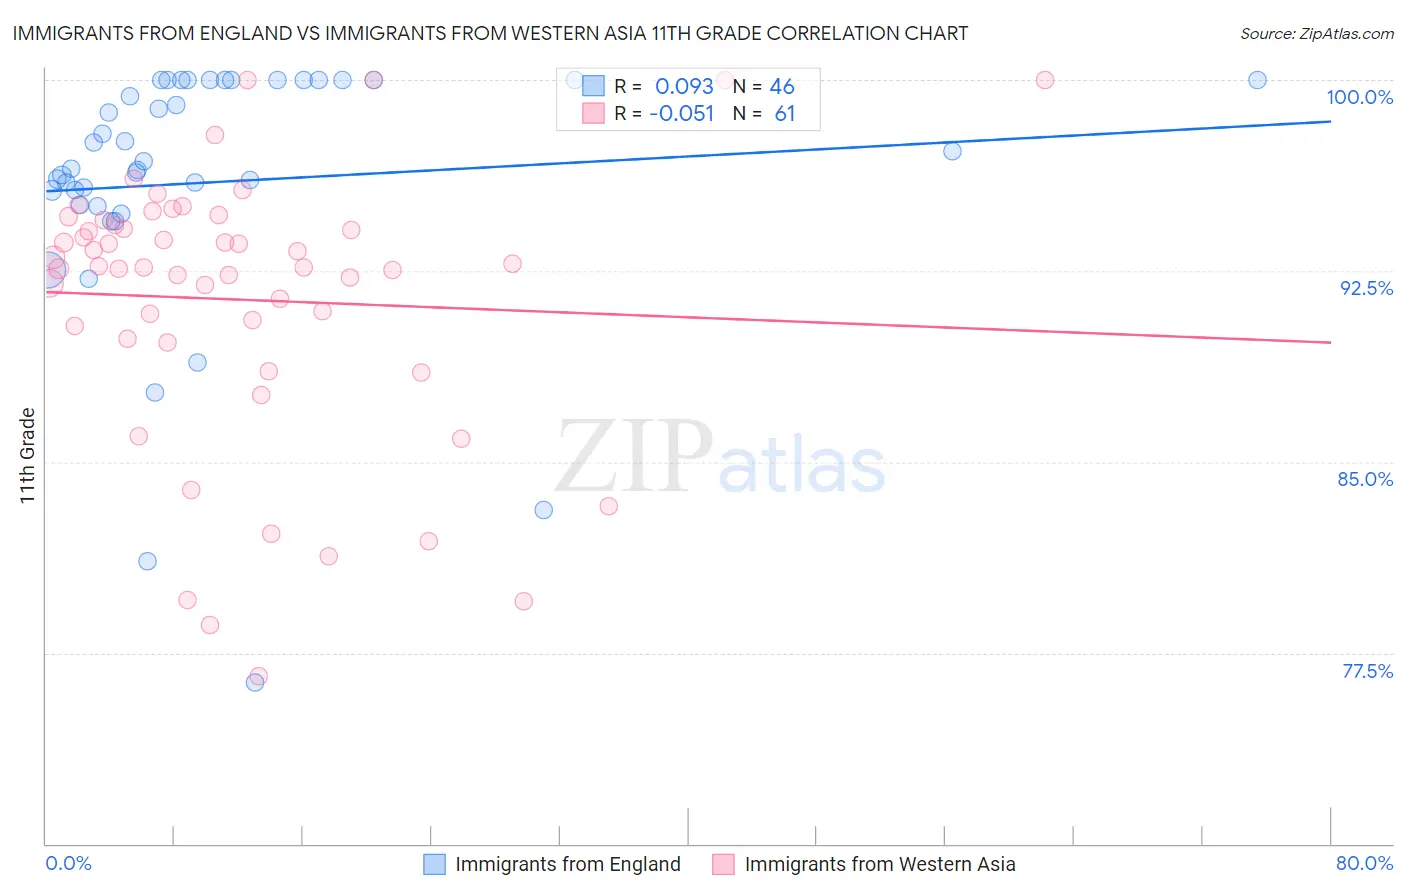
Immigrants from England vs Immigrants from Western Asia 11th Grade Correlation Chart
The statistical analysis conducted on geographies consisting of 391,897,612 people shows a slight positive correlation between the proportion of Immigrants from England and percentage of population with at least 11th grade education in the United States with a correlation coefficient (R) of 0.093 and weighted average of 93.8%. Similarly, the statistical analysis conducted on geographies consisting of 404,433,811 people shows a slight negative correlation between the proportion of Immigrants from Western Asia and percentage of population with at least 11th grade education in the United States with a correlation coefficient (R) of -0.051 and weighted average of 92.4%, a difference of 1.6%.
11th Grade Correlation Summary
| Measurement | Immigrants from England | Immigrants from Western Asia |
| Minimum | 76.3% | 76.6% |
| Maximum | 100.0% | 100.0% |
| Range | 23.7% | 23.4% |
| Mean | 96.0% | 91.4% |
| Median | 96.7% | 92.6% |
| Interquartile 25% (IQ1) | 95.1% | 89.8% |
| Interquartile 75% (IQ3) | 100.0% | 94.4% |
| Interquartile Range (IQR) | 4.9% | 4.6% |
| Standard Deviation (Sample) | 5.2% | 5.4% |
| Standard Deviation (Population) | 5.1% | 5.3% |
Similar Demographics by 11th Grade
Demographics Similar to Immigrants from England by 11th Grade
In terms of 11th grade, the demographic groups most similar to Immigrants from England are Immigrants from South Africa (93.8%, a difference of 0.010%), Immigrants from Japan (93.8%, a difference of 0.040%), Zimbabwean (93.9%, a difference of 0.060%), Scotch-Irish (93.9%, a difference of 0.060%), and Romanian (93.8%, a difference of 0.060%).
| Demographics | Rating | Rank | 11th Grade |
| Ukrainians | 99.8 /100 | #63 | Exceptional 94.0% |
| Immigrants | Sweden | 99.8 /100 | #64 | Exceptional 93.9% |
| Native Hawaiians | 99.8 /100 | #65 | Exceptional 93.9% |
| Alaskan Athabascans | 99.8 /100 | #66 | Exceptional 93.9% |
| Immigrants | Netherlands | 99.8 /100 | #67 | Exceptional 93.9% |
| Zimbabweans | 99.8 /100 | #68 | Exceptional 93.9% |
| Scotch-Irish | 99.8 /100 | #69 | Exceptional 93.9% |
| Immigrants | England | 99.7 /100 | #70 | Exceptional 93.8% |
| Immigrants | South Africa | 99.7 /100 | #71 | Exceptional 93.8% |
| Immigrants | Japan | 99.7 /100 | #72 | Exceptional 93.8% |
| Romanians | 99.6 /100 | #73 | Exceptional 93.8% |
| Immigrants | Czechoslovakia | 99.6 /100 | #74 | Exceptional 93.8% |
| Immigrants | Latvia | 99.6 /100 | #75 | Exceptional 93.8% |
| Celtics | 99.5 /100 | #76 | Exceptional 93.7% |
| Aleuts | 99.5 /100 | #77 | Exceptional 93.7% |
Demographics Similar to Immigrants from Western Asia by 11th Grade
In terms of 11th grade, the demographic groups most similar to Immigrants from Western Asia are Arapaho (92.4%, a difference of 0.0%), Immigrants from Indonesia (92.4%, a difference of 0.010%), Immigrants from Nepal (92.4%, a difference of 0.020%), Immigrants from Chile (92.4%, a difference of 0.020%), and Immigrants from Malaysia (92.4%, a difference of 0.030%).
| Demographics | Rating | Rank | 11th Grade |
| Inupiat | 40.7 /100 | #180 | Average 92.4% |
| Cherokee | 40.7 /100 | #181 | Average 92.4% |
| Immigrants | Morocco | 38.6 /100 | #182 | Fair 92.4% |
| Immigrants | Malaysia | 37.6 /100 | #183 | Fair 92.4% |
| Immigrants | Asia | 37.4 /100 | #184 | Fair 92.4% |
| Immigrants | Nepal | 36.4 /100 | #185 | Fair 92.4% |
| Arapaho | 35.1 /100 | #186 | Fair 92.4% |
| Immigrants | Western Asia | 35.0 /100 | #187 | Fair 92.4% |
| Immigrants | Indonesia | 33.7 /100 | #188 | Fair 92.4% |
| Immigrants | Chile | 33.3 /100 | #189 | Fair 92.4% |
| Chickasaw | 31.4 /100 | #190 | Fair 92.3% |
| French American Indians | 30.8 /100 | #191 | Fair 92.3% |
| Immigrants | Syria | 30.4 /100 | #192 | Fair 92.3% |
| Moroccans | 28.7 /100 | #193 | Fair 92.3% |
| Sioux | 28.5 /100 | #194 | Fair 92.3% |