Immigrants from Ecuador vs Immigrants from Eastern Europe In Labor Force | Age 45-54
COMPARE
Immigrants from Ecuador
Immigrants from Eastern Europe
In Labor Force | Age 45-54
In Labor Force | Age 45-54 Comparison
Immigrants from Ecuador
Immigrants from Eastern Europe
82.2%
IN LABOR FORCE | AGE 45-54
3.4/ 100
METRIC RATING
222nd/ 347
METRIC RANK
83.3%
IN LABOR FORCE | AGE 45-54
95.6/ 100
METRIC RATING
87th/ 347
METRIC RANK
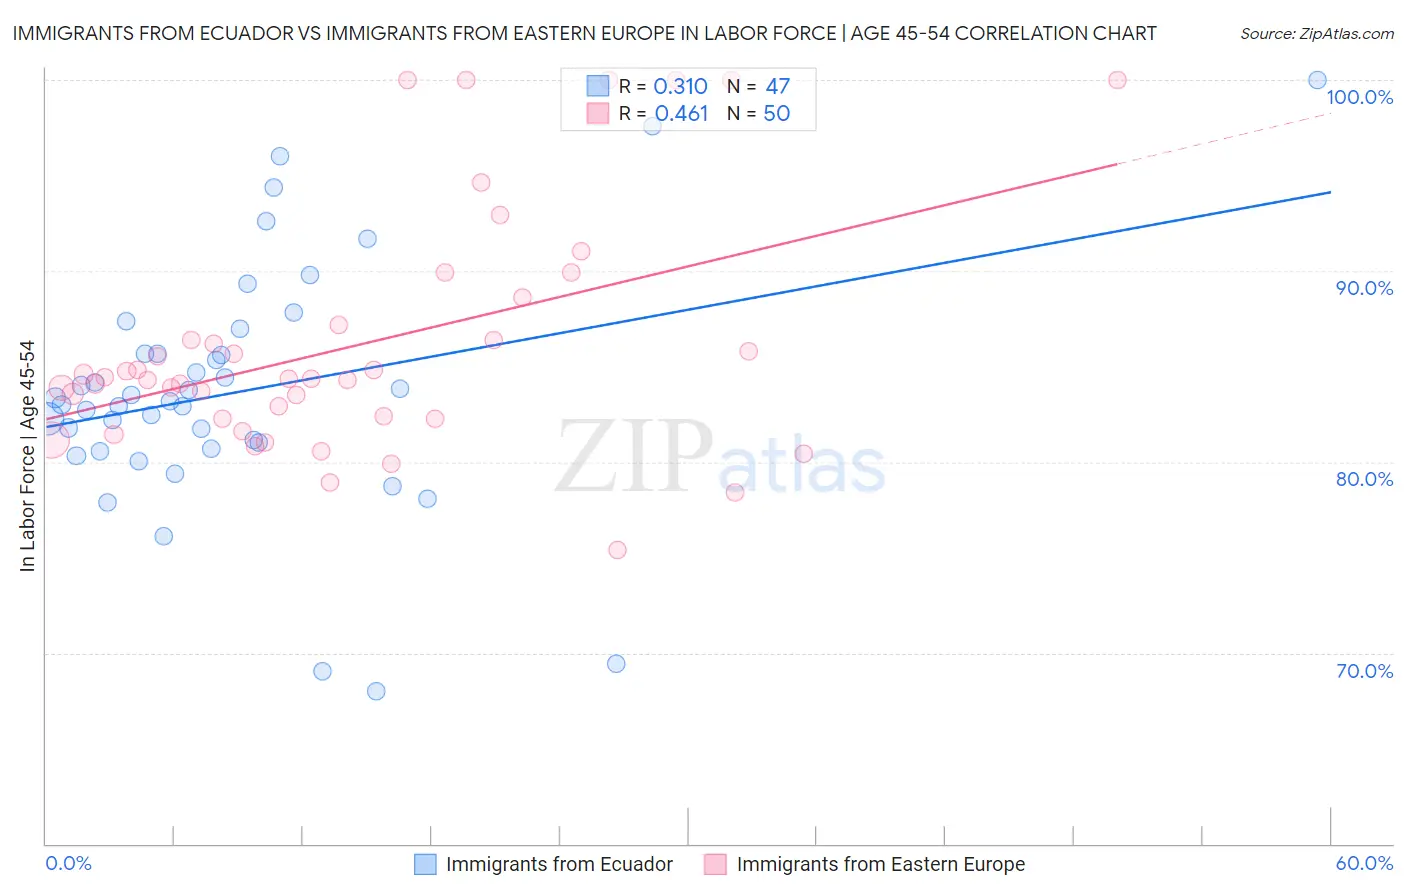
Immigrants from Ecuador vs Immigrants from Eastern Europe In Labor Force | Age 45-54 Correlation Chart
The statistical analysis conducted on geographies consisting of 270,878,287 people shows a mild positive correlation between the proportion of Immigrants from Ecuador and labor force participation rate among population between the ages 45 and 54 in the United States with a correlation coefficient (R) of 0.310 and weighted average of 82.2%. Similarly, the statistical analysis conducted on geographies consisting of 475,461,261 people shows a moderate positive correlation between the proportion of Immigrants from Eastern Europe and labor force participation rate among population between the ages 45 and 54 in the United States with a correlation coefficient (R) of 0.461 and weighted average of 83.3%, a difference of 1.4%.
In Labor Force | Age 45-54 Correlation Summary
| Measurement | Immigrants from Ecuador | Immigrants from Eastern Europe |
| Minimum | 68.0% | 75.4% |
| Maximum | 100.0% | 100.0% |
| Range | 32.0% | 24.6% |
| Mean | 83.7% | 86.1% |
| Median | 83.2% | 84.4% |
| Interquartile 25% (IQ1) | 80.7% | 82.3% |
| Interquartile 75% (IQ3) | 85.7% | 87.1% |
| Interquartile Range (IQR) | 5.0% | 4.9% |
| Standard Deviation (Sample) | 6.4% | 6.2% |
| Standard Deviation (Population) | 6.4% | 6.2% |
Similar Demographics by In Labor Force | Age 45-54
Demographics Similar to Immigrants from Ecuador by In Labor Force | Age 45-54
In terms of in labor force | age 45-54, the demographic groups most similar to Immigrants from Ecuador are Panamanian (82.2%, a difference of 0.0%), Bahamian (82.2%, a difference of 0.010%), Immigrants (82.1%, a difference of 0.020%), French (82.2%, a difference of 0.040%), and English (82.2%, a difference of 0.060%).
| Demographics | Rating | Rank | In Labor Force | Age 45-54 |
| Iraqis | 5.6 /100 | #215 | Tragic 82.2% |
| Scottish | 5.3 /100 | #216 | Tragic 82.2% |
| Portuguese | 4.7 /100 | #217 | Tragic 82.2% |
| English | 4.4 /100 | #218 | Tragic 82.2% |
| French | 4.1 /100 | #219 | Tragic 82.2% |
| Bahamians | 3.6 /100 | #220 | Tragic 82.2% |
| Panamanians | 3.5 /100 | #221 | Tragic 82.2% |
| Immigrants | Ecuador | 3.4 /100 | #222 | Tragic 82.2% |
| Immigrants | Immigrants | 3.1 /100 | #223 | Tragic 82.1% |
| Immigrants | Jamaica | 2.7 /100 | #224 | Tragic 82.1% |
| Immigrants | Oceania | 2.5 /100 | #225 | Tragic 82.1% |
| Immigrants | Caribbean | 2.5 /100 | #226 | Tragic 82.1% |
| Immigrants | Germany | 2.4 /100 | #227 | Tragic 82.1% |
| Cape Verdeans | 2.1 /100 | #228 | Tragic 82.1% |
| Immigrants | Burma/Myanmar | 1.9 /100 | #229 | Tragic 82.0% |
Demographics Similar to Immigrants from Eastern Europe by In Labor Force | Age 45-54
In terms of in labor force | age 45-54, the demographic groups most similar to Immigrants from Eastern Europe are Immigrants from Northern Africa (83.3%, a difference of 0.0%), Immigrants from Asia (83.3%, a difference of 0.0%), Indian (Asian) (83.3%, a difference of 0.0%), Immigrants from Japan (83.3%, a difference of 0.0%), and South American (83.3%, a difference of 0.010%).
| Demographics | Rating | Rank | In Labor Force | Age 45-54 |
| Immigrants | Croatia | 96.5 /100 | #80 | Exceptional 83.4% |
| Jordanians | 96.4 /100 | #81 | Exceptional 83.4% |
| Immigrants | Eastern Asia | 96.3 /100 | #82 | Exceptional 83.4% |
| Immigrants | Zimbabwe | 96.3 /100 | #83 | Exceptional 83.4% |
| Immigrants | Bosnia and Herzegovina | 96.0 /100 | #84 | Exceptional 83.3% |
| Greeks | 95.9 /100 | #85 | Exceptional 83.3% |
| Immigrants | Northern Africa | 95.7 /100 | #86 | Exceptional 83.3% |
| Immigrants | Eastern Europe | 95.6 /100 | #87 | Exceptional 83.3% |
| Immigrants | Asia | 95.6 /100 | #88 | Exceptional 83.3% |
| Indians (Asian) | 95.5 /100 | #89 | Exceptional 83.3% |
| Immigrants | Japan | 95.5 /100 | #90 | Exceptional 83.3% |
| South Americans | 95.5 /100 | #91 | Exceptional 83.3% |
| Danes | 95.3 /100 | #92 | Exceptional 83.3% |
| Italians | 95.1 /100 | #93 | Exceptional 83.3% |
| Argentineans | 94.9 /100 | #94 | Exceptional 83.3% |