Immigrants from Ecuador vs British In Labor Force | Age 20-24
COMPARE
Immigrants from Ecuador
British
In Labor Force | Age 20-24
In Labor Force | Age 20-24 Comparison
Immigrants from Ecuador
British
72.3%
IN LABOR FORCE | AGE 20-24
0.0/ 100
METRIC RATING
307th/ 347
METRIC RANK
76.7%
IN LABOR FORCE | AGE 20-24
99.8/ 100
METRIC RATING
73rd/ 347
METRIC RANK
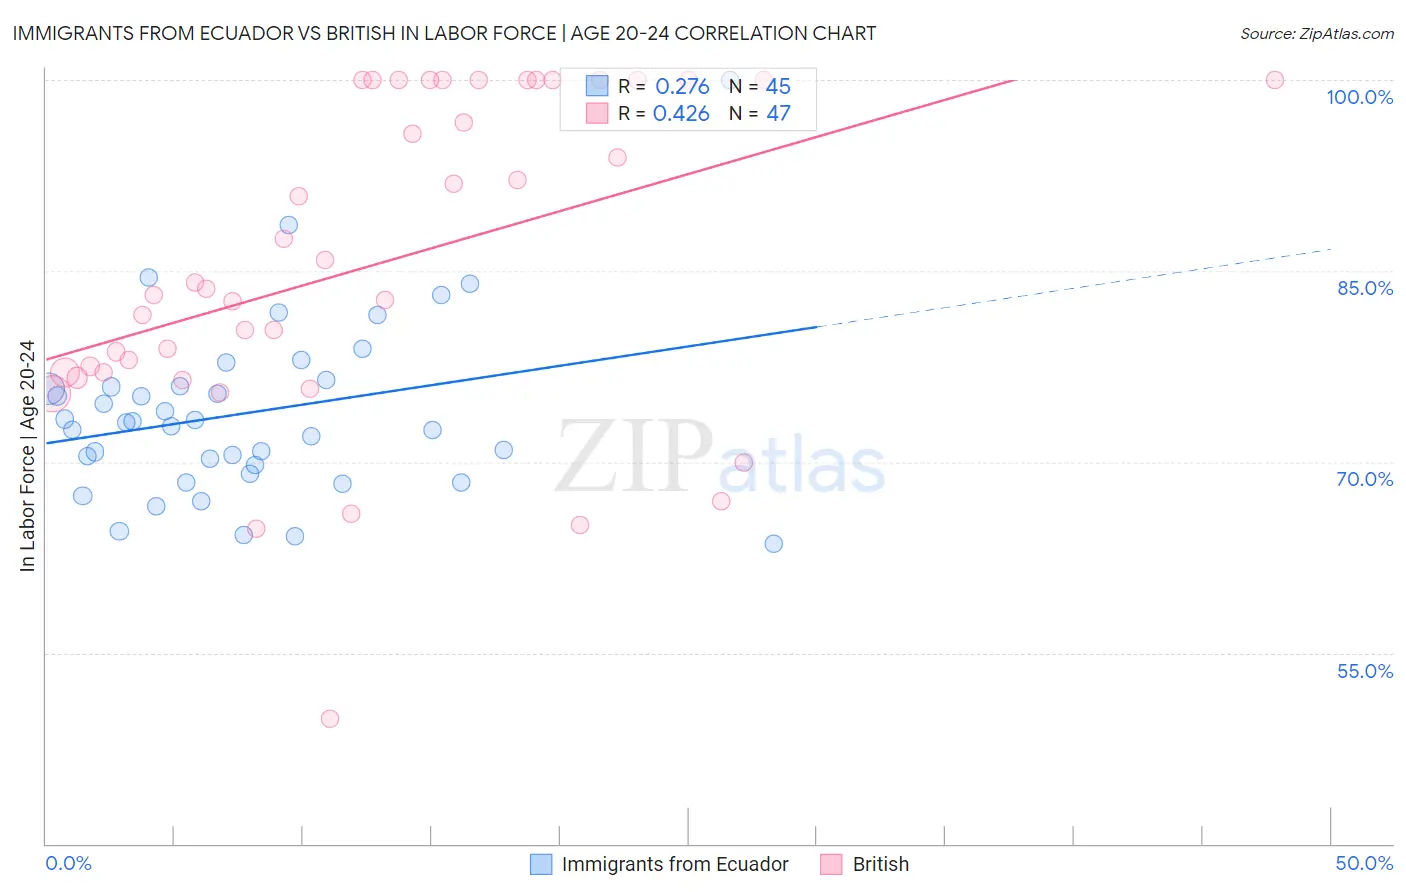
Immigrants from Ecuador vs British In Labor Force | Age 20-24 Correlation Chart
The statistical analysis conducted on geographies consisting of 270,992,575 people shows a weak positive correlation between the proportion of Immigrants from Ecuador and labor force participation rate among population between the ages 20 and 24 in the United States with a correlation coefficient (R) of 0.276 and weighted average of 72.3%. Similarly, the statistical analysis conducted on geographies consisting of 530,798,308 people shows a moderate positive correlation between the proportion of British and labor force participation rate among population between the ages 20 and 24 in the United States with a correlation coefficient (R) of 0.426 and weighted average of 76.7%, a difference of 6.1%.
In Labor Force | Age 20-24 Correlation Summary
| Measurement | Immigrants from Ecuador | British |
| Minimum | 63.6% | 49.8% |
| Maximum | 100.0% | 100.0% |
| Range | 36.4% | 50.2% |
| Mean | 73.9% | 85.6% |
| Median | 73.1% | 83.6% |
| Interquartile 25% (IQ1) | 69.4% | 77.0% |
| Interquartile 75% (IQ3) | 76.2% | 100.0% |
| Interquartile Range (IQR) | 6.7% | 23.0% |
| Standard Deviation (Sample) | 7.0% | 12.7% |
| Standard Deviation (Population) | 6.9% | 12.5% |
Similar Demographics by In Labor Force | Age 20-24
Demographics Similar to Immigrants from Ecuador by In Labor Force | Age 20-24
In terms of in labor force | age 20-24, the demographic groups most similar to Immigrants from Ecuador are Soviet Union (72.3%, a difference of 0.010%), Tsimshian (72.3%, a difference of 0.010%), Immigrants from Jamaica (72.4%, a difference of 0.15%), Immigrants from Singapore (72.4%, a difference of 0.17%), and Immigrants from West Indies (72.4%, a difference of 0.20%).
| Demographics | Rating | Rank | In Labor Force | Age 20-24 |
| Armenians | 0.0 /100 | #300 | Tragic 72.5% |
| Cubans | 0.0 /100 | #301 | Tragic 72.5% |
| Natives/Alaskans | 0.0 /100 | #302 | Tragic 72.4% |
| Ecuadorians | 0.0 /100 | #303 | Tragic 72.4% |
| Immigrants | West Indies | 0.0 /100 | #304 | Tragic 72.4% |
| Immigrants | Singapore | 0.0 /100 | #305 | Tragic 72.4% |
| Immigrants | Jamaica | 0.0 /100 | #306 | Tragic 72.4% |
| Immigrants | Ecuador | 0.0 /100 | #307 | Tragic 72.3% |
| Soviet Union | 0.0 /100 | #308 | Tragic 72.3% |
| Tsimshian | 0.0 /100 | #309 | Tragic 72.3% |
| Immigrants | Cuba | 0.0 /100 | #310 | Tragic 72.0% |
| Apache | 0.0 /100 | #311 | Tragic 72.0% |
| Immigrants | Caribbean | 0.0 /100 | #312 | Tragic 71.9% |
| Immigrants | Dominica | 0.0 /100 | #313 | Tragic 71.9% |
| Indians (Asian) | 0.0 /100 | #314 | Tragic 71.9% |
Demographics Similar to British by In Labor Force | Age 20-24
In terms of in labor force | age 20-24, the demographic groups most similar to British are Guamanian/Chamorro (76.7%, a difference of 0.050%), Cree (76.6%, a difference of 0.070%), Northern European (76.8%, a difference of 0.080%), Immigrants from Middle Africa (76.6%, a difference of 0.090%), and Immigrants from Moldova (76.6%, a difference of 0.13%).
| Demographics | Rating | Rank | In Labor Force | Age 20-24 |
| Icelanders | 99.9 /100 | #66 | Exceptional 76.9% |
| Slavs | 99.9 /100 | #67 | Exceptional 76.9% |
| French American Indians | 99.8 /100 | #68 | Exceptional 76.8% |
| Immigrants | Sudan | 99.8 /100 | #69 | Exceptional 76.8% |
| Ottawa | 99.8 /100 | #70 | Exceptional 76.8% |
| Northern Europeans | 99.8 /100 | #71 | Exceptional 76.8% |
| Guamanians/Chamorros | 99.8 /100 | #72 | Exceptional 76.7% |
| British | 99.8 /100 | #73 | Exceptional 76.7% |
| Cree | 99.7 /100 | #74 | Exceptional 76.6% |
| Immigrants | Middle Africa | 99.7 /100 | #75 | Exceptional 76.6% |
| Immigrants | Moldova | 99.6 /100 | #76 | Exceptional 76.6% |
| Immigrants | Cameroon | 99.6 /100 | #77 | Exceptional 76.6% |
| Canadians | 99.6 /100 | #78 | Exceptional 76.6% |
| Immigrants | Zaire | 99.6 /100 | #79 | Exceptional 76.6% |
| Italians | 99.6 /100 | #80 | Exceptional 76.5% |