Immigrants from Ecuador vs British In Labor Force | Age 25-29
COMPARE
Immigrants from Ecuador
British
In Labor Force | Age 25-29
In Labor Force | Age 25-29 Comparison
Immigrants from Ecuador
British
84.3%
IN LABOR FORCE | AGE 25-29
9.3/ 100
METRIC RATING
217th/ 347
METRIC RANK
84.7%
IN LABOR FORCE | AGE 25-29
60.4/ 100
METRIC RATING
157th/ 347
METRIC RANK
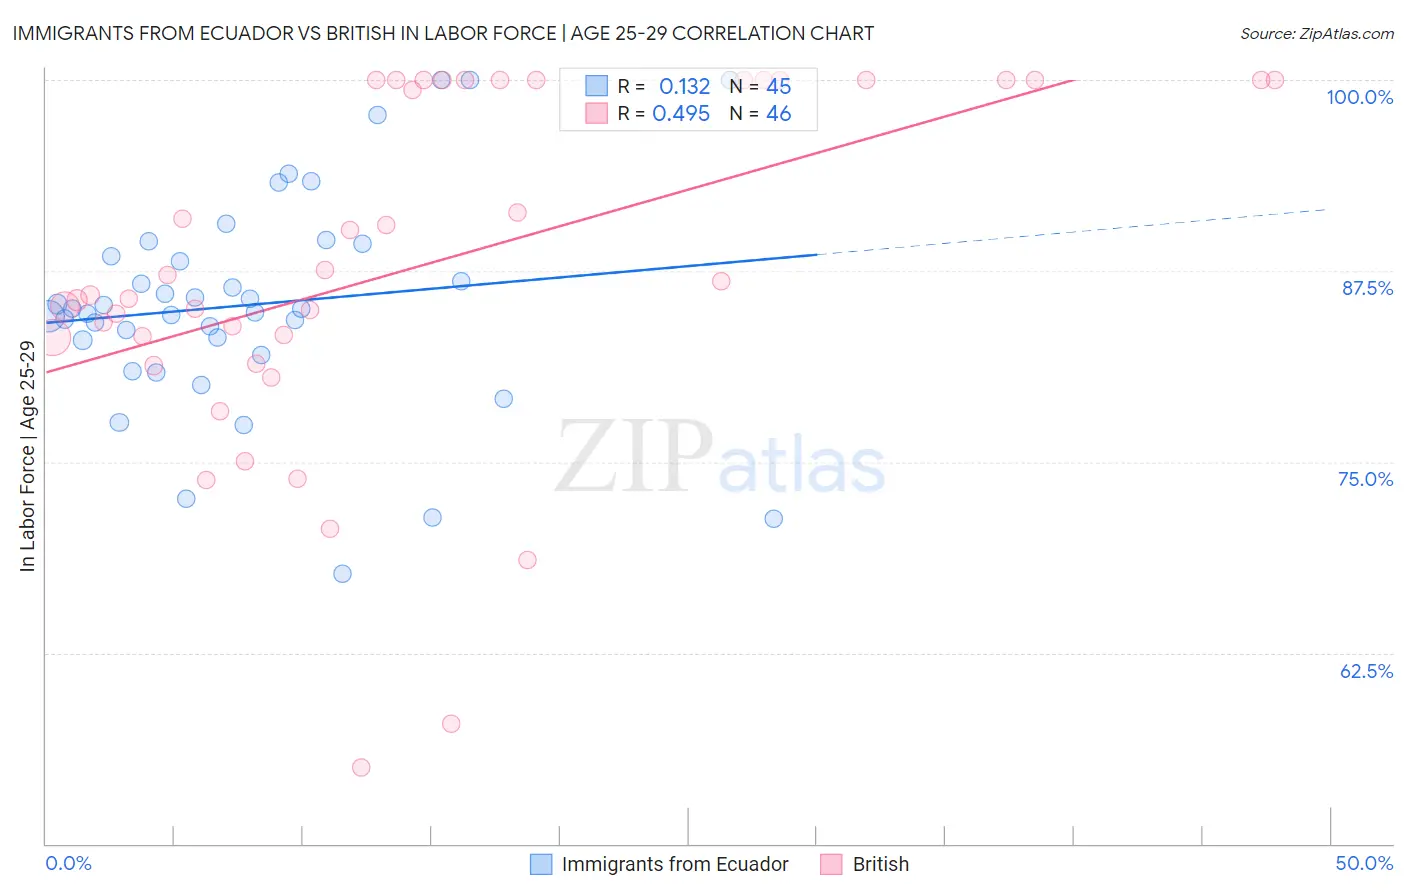
Immigrants from Ecuador vs British In Labor Force | Age 25-29 Correlation Chart
The statistical analysis conducted on geographies consisting of 270,970,556 people shows a poor positive correlation between the proportion of Immigrants from Ecuador and labor force participation rate among population between the ages 25 and 29 in the United States with a correlation coefficient (R) of 0.132 and weighted average of 84.3%. Similarly, the statistical analysis conducted on geographies consisting of 530,868,549 people shows a moderate positive correlation between the proportion of British and labor force participation rate among population between the ages 25 and 29 in the United States with a correlation coefficient (R) of 0.495 and weighted average of 84.7%, a difference of 0.50%.
In Labor Force | Age 25-29 Correlation Summary
| Measurement | Immigrants from Ecuador | British |
| Minimum | 67.7% | 55.0% |
| Maximum | 100.0% | 100.0% |
| Range | 32.3% | 45.0% |
| Mean | 85.3% | 87.7% |
| Median | 85.0% | 86.4% |
| Interquartile 25% (IQ1) | 82.5% | 83.1% |
| Interquartile 75% (IQ3) | 88.9% | 100.0% |
| Interquartile Range (IQR) | 6.4% | 16.9% |
| Standard Deviation (Sample) | 7.1% | 11.5% |
| Standard Deviation (Population) | 7.0% | 11.4% |
Similar Demographics by In Labor Force | Age 25-29
Demographics Similar to Immigrants from Ecuador by In Labor Force | Age 25-29
In terms of in labor force | age 25-29, the demographic groups most similar to Immigrants from Ecuador are Israeli (84.3%, a difference of 0.0%), Immigrants from Nigeria (84.3%, a difference of 0.010%), Immigrants from Saudi Arabia (84.3%, a difference of 0.010%), Immigrants from Syria (84.3%, a difference of 0.030%), and Japanese (84.3%, a difference of 0.040%).
| Demographics | Rating | Rank | In Labor Force | Age 25-29 |
| Chinese | 12.7 /100 | #210 | Poor 84.3% |
| Immigrants | Venezuela | 12.6 /100 | #211 | Poor 84.3% |
| Sub-Saharan Africans | 11.7 /100 | #212 | Poor 84.3% |
| Japanese | 11.4 /100 | #213 | Poor 84.3% |
| Lebanese | 11.1 /100 | #214 | Poor 84.3% |
| Immigrants | Syria | 10.7 /100 | #215 | Poor 84.3% |
| Israelis | 9.3 /100 | #216 | Tragic 84.3% |
| Immigrants | Ecuador | 9.3 /100 | #217 | Tragic 84.3% |
| Immigrants | Nigeria | 9.0 /100 | #218 | Tragic 84.3% |
| Immigrants | Saudi Arabia | 8.8 /100 | #219 | Tragic 84.3% |
| Nigerians | 7.2 /100 | #220 | Tragic 84.3% |
| Arabs | 6.8 /100 | #221 | Tragic 84.2% |
| Jordanians | 6.7 /100 | #222 | Tragic 84.2% |
| Scotch-Irish | 6.5 /100 | #223 | Tragic 84.2% |
| Immigrants | West Indies | 6.0 /100 | #224 | Tragic 84.2% |
Demographics Similar to British by In Labor Force | Age 25-29
In terms of in labor force | age 25-29, the demographic groups most similar to British are French (84.7%, a difference of 0.0%), Immigrants from Ghana (84.7%, a difference of 0.0%), Immigrants from Western Africa (84.7%, a difference of 0.0%), Immigrants from Taiwan (84.7%, a difference of 0.010%), and Immigrants from Sri Lanka (84.7%, a difference of 0.010%).
| Demographics | Rating | Rank | In Labor Force | Age 25-29 |
| Swiss | 64.7 /100 | #150 | Good 84.7% |
| Colombians | 62.8 /100 | #151 | Good 84.7% |
| Immigrants | Pakistan | 62.7 /100 | #152 | Good 84.7% |
| Immigrants | Taiwan | 62.2 /100 | #153 | Good 84.7% |
| Immigrants | Sri Lanka | 61.7 /100 | #154 | Good 84.7% |
| Indians (Asian) | 61.6 /100 | #155 | Good 84.7% |
| French | 61.0 /100 | #156 | Good 84.7% |
| British | 60.4 /100 | #157 | Good 84.7% |
| Immigrants | Ghana | 60.2 /100 | #158 | Good 84.7% |
| Immigrants | Western Africa | 60.1 /100 | #159 | Good 84.7% |
| Immigrants | Peru | 58.6 /100 | #160 | Average 84.7% |
| Canadians | 58.5 /100 | #161 | Average 84.7% |
| Immigrants | Colombia | 58.3 /100 | #162 | Average 84.7% |
| Argentineans | 57.9 /100 | #163 | Average 84.7% |
| Ghanaians | 57.6 /100 | #164 | Average 84.7% |