Nicaraguan vs British In Labor Force | Age 20-24
COMPARE
Nicaraguan
British
In Labor Force | Age 20-24
In Labor Force | Age 20-24 Comparison
Nicaraguans
British
73.2%
IN LABOR FORCE | AGE 20-24
0.1/ 100
METRIC RATING
285th/ 347
METRIC RANK
76.7%
IN LABOR FORCE | AGE 20-24
99.8/ 100
METRIC RATING
73rd/ 347
METRIC RANK
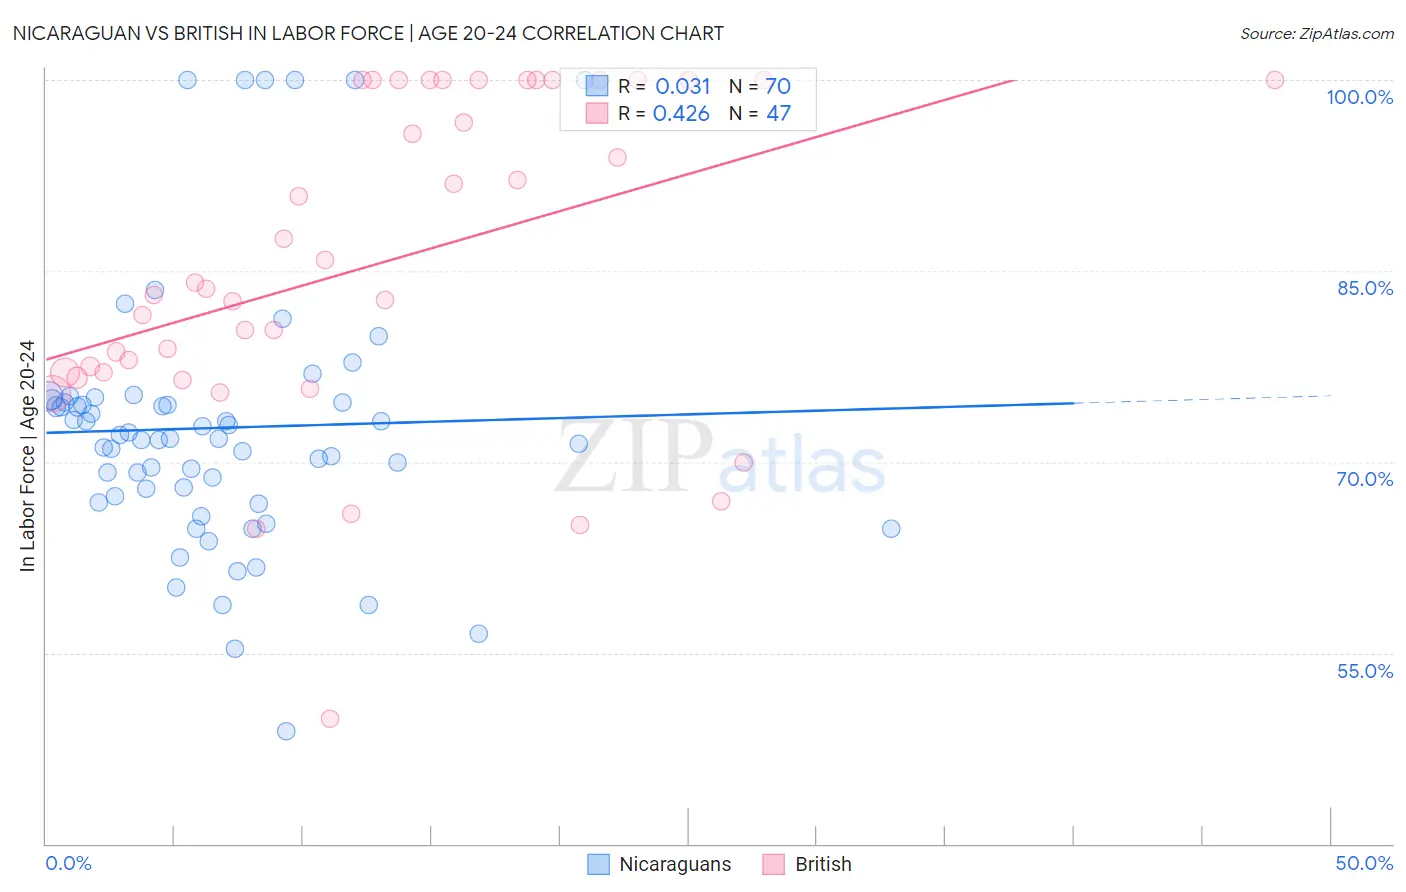
Nicaraguan vs British In Labor Force | Age 20-24 Correlation Chart
The statistical analysis conducted on geographies consisting of 285,678,099 people shows no correlation between the proportion of Nicaraguans and labor force participation rate among population between the ages 20 and 24 in the United States with a correlation coefficient (R) of 0.031 and weighted average of 73.2%. Similarly, the statistical analysis conducted on geographies consisting of 530,798,308 people shows a moderate positive correlation between the proportion of British and labor force participation rate among population between the ages 20 and 24 in the United States with a correlation coefficient (R) of 0.426 and weighted average of 76.7%, a difference of 4.8%.
In Labor Force | Age 20-24 Correlation Summary
| Measurement | Nicaraguan | British |
| Minimum | 48.8% | 49.8% |
| Maximum | 100.0% | 100.0% |
| Range | 51.2% | 50.2% |
| Mean | 72.7% | 85.6% |
| Median | 71.8% | 83.6% |
| Interquartile 25% (IQ1) | 67.3% | 77.0% |
| Interquartile 75% (IQ3) | 74.7% | 100.0% |
| Interquartile Range (IQR) | 7.4% | 23.0% |
| Standard Deviation (Sample) | 10.5% | 12.7% |
| Standard Deviation (Population) | 10.4% | 12.5% |
Similar Demographics by In Labor Force | Age 20-24
Demographics Similar to Nicaraguans by In Labor Force | Age 20-24
In terms of in labor force | age 20-24, the demographic groups most similar to Nicaraguans are Immigrants from Lebanon (73.1%, a difference of 0.030%), Immigrants from Korea (73.1%, a difference of 0.050%), Kiowa (73.2%, a difference of 0.060%), Immigrants from Bahamas (73.2%, a difference of 0.080%), and Immigrants from Venezuela (73.2%, a difference of 0.090%).
| Demographics | Rating | Rank | In Labor Force | Age 20-24 |
| Cypriots | 0.2 /100 | #278 | Tragic 73.3% |
| Venezuelans | 0.2 /100 | #279 | Tragic 73.3% |
| Bahamians | 0.1 /100 | #280 | Tragic 73.3% |
| Immigrants | Venezuela | 0.1 /100 | #281 | Tragic 73.2% |
| Immigrants | Spain | 0.1 /100 | #282 | Tragic 73.2% |
| Immigrants | Bahamas | 0.1 /100 | #283 | Tragic 73.2% |
| Kiowa | 0.1 /100 | #284 | Tragic 73.2% |
| Nicaraguans | 0.1 /100 | #285 | Tragic 73.2% |
| Immigrants | Lebanon | 0.1 /100 | #286 | Tragic 73.1% |
| Immigrants | Korea | 0.1 /100 | #287 | Tragic 73.1% |
| Argentineans | 0.1 /100 | #288 | Tragic 73.1% |
| U.S. Virgin Islanders | 0.1 /100 | #289 | Tragic 73.0% |
| Immigrants | Belarus | 0.1 /100 | #290 | Tragic 73.0% |
| Immigrants | Nicaragua | 0.0 /100 | #291 | Tragic 72.9% |
| Pueblo | 0.0 /100 | #292 | Tragic 72.9% |
Demographics Similar to British by In Labor Force | Age 20-24
In terms of in labor force | age 20-24, the demographic groups most similar to British are Guamanian/Chamorro (76.7%, a difference of 0.050%), Cree (76.6%, a difference of 0.070%), Northern European (76.8%, a difference of 0.080%), Immigrants from Middle Africa (76.6%, a difference of 0.090%), and Immigrants from Moldova (76.6%, a difference of 0.13%).
| Demographics | Rating | Rank | In Labor Force | Age 20-24 |
| Icelanders | 99.9 /100 | #66 | Exceptional 76.9% |
| Slavs | 99.9 /100 | #67 | Exceptional 76.9% |
| French American Indians | 99.8 /100 | #68 | Exceptional 76.8% |
| Immigrants | Sudan | 99.8 /100 | #69 | Exceptional 76.8% |
| Ottawa | 99.8 /100 | #70 | Exceptional 76.8% |
| Northern Europeans | 99.8 /100 | #71 | Exceptional 76.8% |
| Guamanians/Chamorros | 99.8 /100 | #72 | Exceptional 76.7% |
| British | 99.8 /100 | #73 | Exceptional 76.7% |
| Cree | 99.7 /100 | #74 | Exceptional 76.6% |
| Immigrants | Middle Africa | 99.7 /100 | #75 | Exceptional 76.6% |
| Immigrants | Moldova | 99.6 /100 | #76 | Exceptional 76.6% |
| Immigrants | Cameroon | 99.6 /100 | #77 | Exceptional 76.6% |
| Canadians | 99.6 /100 | #78 | Exceptional 76.6% |
| Immigrants | Zaire | 99.6 /100 | #79 | Exceptional 76.6% |
| Italians | 99.6 /100 | #80 | Exceptional 76.5% |