Immigrants from Ecuador vs Immigrants from Indonesia In Labor Force | Age 20-24
COMPARE
Immigrants from Ecuador
Immigrants from Indonesia
In Labor Force | Age 20-24
In Labor Force | Age 20-24 Comparison
Immigrants from Ecuador
Immigrants from Indonesia
72.3%
IN LABOR FORCE | AGE 20-24
0.0/ 100
METRIC RATING
307th/ 347
METRIC RANK
73.4%
IN LABOR FORCE | AGE 20-24
0.3/ 100
METRIC RATING
271st/ 347
METRIC RANK
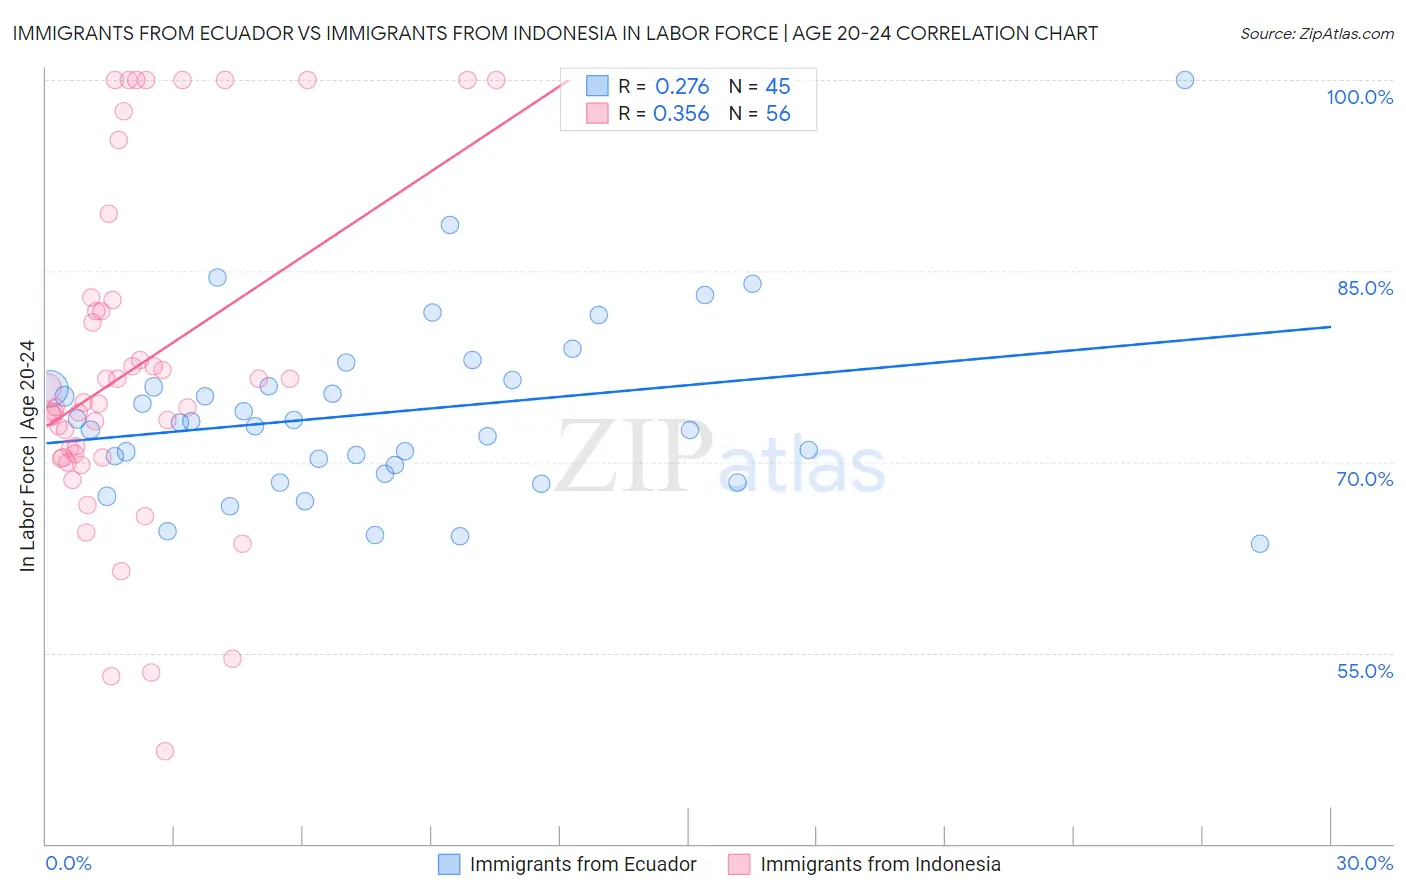
Immigrants from Ecuador vs Immigrants from Indonesia In Labor Force | Age 20-24 Correlation Chart
The statistical analysis conducted on geographies consisting of 270,992,575 people shows a weak positive correlation between the proportion of Immigrants from Ecuador and labor force participation rate among population between the ages 20 and 24 in the United States with a correlation coefficient (R) of 0.276 and weighted average of 72.3%. Similarly, the statistical analysis conducted on geographies consisting of 215,731,978 people shows a mild positive correlation between the proportion of Immigrants from Indonesia and labor force participation rate among population between the ages 20 and 24 in the United States with a correlation coefficient (R) of 0.356 and weighted average of 73.4%, a difference of 1.6%.
In Labor Force | Age 20-24 Correlation Summary
| Measurement | Immigrants from Ecuador | Immigrants from Indonesia |
| Minimum | 63.6% | 47.3% |
| Maximum | 100.0% | 100.0% |
| Range | 36.4% | 52.7% |
| Mean | 73.9% | 77.4% |
| Median | 73.1% | 74.4% |
| Interquartile 25% (IQ1) | 69.4% | 70.4% |
| Interquartile 75% (IQ3) | 76.2% | 82.3% |
| Interquartile Range (IQR) | 6.7% | 11.9% |
| Standard Deviation (Sample) | 7.0% | 13.3% |
| Standard Deviation (Population) | 6.9% | 13.1% |
Similar Demographics by In Labor Force | Age 20-24
Demographics Similar to Immigrants from Ecuador by In Labor Force | Age 20-24
In terms of in labor force | age 20-24, the demographic groups most similar to Immigrants from Ecuador are Soviet Union (72.3%, a difference of 0.010%), Tsimshian (72.3%, a difference of 0.010%), Immigrants from Jamaica (72.4%, a difference of 0.15%), Immigrants from Singapore (72.4%, a difference of 0.17%), and Immigrants from West Indies (72.4%, a difference of 0.20%).
| Demographics | Rating | Rank | In Labor Force | Age 20-24 |
| Armenians | 0.0 /100 | #300 | Tragic 72.5% |
| Cubans | 0.0 /100 | #301 | Tragic 72.5% |
| Natives/Alaskans | 0.0 /100 | #302 | Tragic 72.4% |
| Ecuadorians | 0.0 /100 | #303 | Tragic 72.4% |
| Immigrants | West Indies | 0.0 /100 | #304 | Tragic 72.4% |
| Immigrants | Singapore | 0.0 /100 | #305 | Tragic 72.4% |
| Immigrants | Jamaica | 0.0 /100 | #306 | Tragic 72.4% |
| Immigrants | Ecuador | 0.0 /100 | #307 | Tragic 72.3% |
| Soviet Union | 0.0 /100 | #308 | Tragic 72.3% |
| Tsimshian | 0.0 /100 | #309 | Tragic 72.3% |
| Immigrants | Cuba | 0.0 /100 | #310 | Tragic 72.0% |
| Apache | 0.0 /100 | #311 | Tragic 72.0% |
| Immigrants | Caribbean | 0.0 /100 | #312 | Tragic 71.9% |
| Immigrants | Dominica | 0.0 /100 | #313 | Tragic 71.9% |
| Indians (Asian) | 0.0 /100 | #314 | Tragic 71.9% |
Demographics Similar to Immigrants from Indonesia by In Labor Force | Age 20-24
In terms of in labor force | age 20-24, the demographic groups most similar to Immigrants from Indonesia are Belizean (73.4%, a difference of 0.010%), Cheyenne (73.4%, a difference of 0.040%), Immigrants from Russia (73.5%, a difference of 0.050%), Immigrants from Colombia (73.4%, a difference of 0.060%), and Colombian (73.5%, a difference of 0.090%).
| Demographics | Rating | Rank | In Labor Force | Age 20-24 |
| Immigrants | Haiti | 0.5 /100 | #264 | Tragic 73.6% |
| Burmese | 0.5 /100 | #265 | Tragic 73.6% |
| Haitians | 0.5 /100 | #266 | Tragic 73.6% |
| Immigrants | Western Asia | 0.4 /100 | #267 | Tragic 73.5% |
| South Americans | 0.4 /100 | #268 | Tragic 73.5% |
| Colombians | 0.3 /100 | #269 | Tragic 73.5% |
| Immigrants | Russia | 0.3 /100 | #270 | Tragic 73.5% |
| Immigrants | Indonesia | 0.3 /100 | #271 | Tragic 73.4% |
| Belizeans | 0.3 /100 | #272 | Tragic 73.4% |
| Cheyenne | 0.2 /100 | #273 | Tragic 73.4% |
| Immigrants | Colombia | 0.2 /100 | #274 | Tragic 73.4% |
| Immigrants | South America | 0.2 /100 | #275 | Tragic 73.3% |
| Mongolians | 0.2 /100 | #276 | Tragic 73.3% |
| Immigrants | Malaysia | 0.2 /100 | #277 | Tragic 73.3% |
| Cypriots | 0.2 /100 | #278 | Tragic 73.3% |