Immigrants from Eastern Europe vs Immigrants from Peru In Labor Force | Age 45-54
COMPARE
Immigrants from Eastern Europe
Immigrants from Peru
In Labor Force | Age 45-54
In Labor Force | Age 45-54 Comparison
Immigrants from Eastern Europe
Immigrants from Peru
83.3%
IN LABOR FORCE | AGE 45-54
95.6/ 100
METRIC RATING
87th/ 347
METRIC RANK
83.5%
IN LABOR FORCE | AGE 45-54
98.6/ 100
METRIC RATING
56th/ 347
METRIC RANK
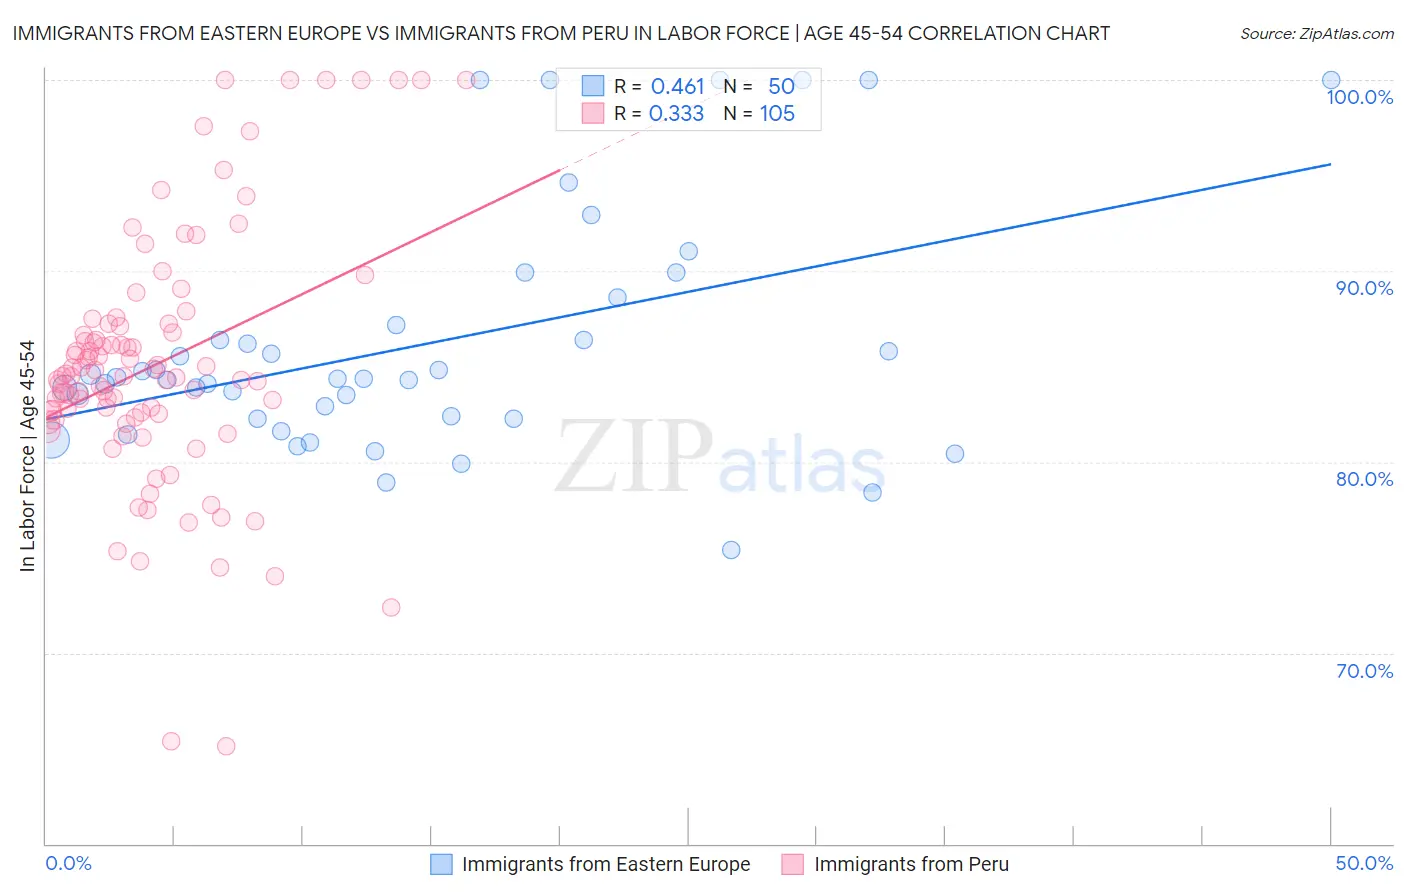
Immigrants from Eastern Europe vs Immigrants from Peru In Labor Force | Age 45-54 Correlation Chart
The statistical analysis conducted on geographies consisting of 475,461,261 people shows a moderate positive correlation between the proportion of Immigrants from Eastern Europe and labor force participation rate among population between the ages 45 and 54 in the United States with a correlation coefficient (R) of 0.461 and weighted average of 83.3%. Similarly, the statistical analysis conducted on geographies consisting of 328,756,555 people shows a mild positive correlation between the proportion of Immigrants from Peru and labor force participation rate among population between the ages 45 and 54 in the United States with a correlation coefficient (R) of 0.333 and weighted average of 83.5%, a difference of 0.25%.
In Labor Force | Age 45-54 Correlation Summary
| Measurement | Immigrants from Eastern Europe | Immigrants from Peru |
| Minimum | 75.4% | 65.1% |
| Maximum | 100.0% | 100.0% |
| Range | 24.6% | 34.9% |
| Mean | 86.1% | 85.1% |
| Median | 84.4% | 84.5% |
| Interquartile 25% (IQ1) | 82.3% | 82.4% |
| Interquartile 75% (IQ3) | 87.1% | 87.2% |
| Interquartile Range (IQR) | 4.9% | 4.7% |
| Standard Deviation (Sample) | 6.2% | 6.6% |
| Standard Deviation (Population) | 6.2% | 6.6% |
Similar Demographics by In Labor Force | Age 45-54
Demographics Similar to Immigrants from Eastern Europe by In Labor Force | Age 45-54
In terms of in labor force | age 45-54, the demographic groups most similar to Immigrants from Eastern Europe are Immigrants from Northern Africa (83.3%, a difference of 0.0%), Immigrants from Asia (83.3%, a difference of 0.0%), Indian (Asian) (83.3%, a difference of 0.0%), Immigrants from Japan (83.3%, a difference of 0.0%), and South American (83.3%, a difference of 0.010%).
| Demographics | Rating | Rank | In Labor Force | Age 45-54 |
| Immigrants | Croatia | 96.5 /100 | #80 | Exceptional 83.4% |
| Jordanians | 96.4 /100 | #81 | Exceptional 83.4% |
| Immigrants | Eastern Asia | 96.3 /100 | #82 | Exceptional 83.4% |
| Immigrants | Zimbabwe | 96.3 /100 | #83 | Exceptional 83.4% |
| Immigrants | Bosnia and Herzegovina | 96.0 /100 | #84 | Exceptional 83.3% |
| Greeks | 95.9 /100 | #85 | Exceptional 83.3% |
| Immigrants | Northern Africa | 95.7 /100 | #86 | Exceptional 83.3% |
| Immigrants | Eastern Europe | 95.6 /100 | #87 | Exceptional 83.3% |
| Immigrants | Asia | 95.6 /100 | #88 | Exceptional 83.3% |
| Indians (Asian) | 95.5 /100 | #89 | Exceptional 83.3% |
| Immigrants | Japan | 95.5 /100 | #90 | Exceptional 83.3% |
| South Americans | 95.5 /100 | #91 | Exceptional 83.3% |
| Danes | 95.3 /100 | #92 | Exceptional 83.3% |
| Italians | 95.1 /100 | #93 | Exceptional 83.3% |
| Argentineans | 94.9 /100 | #94 | Exceptional 83.3% |
Demographics Similar to Immigrants from Peru by In Labor Force | Age 45-54
In terms of in labor force | age 45-54, the demographic groups most similar to Immigrants from Peru are Paraguayan (83.5%, a difference of 0.010%), Somali (83.5%, a difference of 0.020%), Macedonian (83.5%, a difference of 0.020%), Eastern European (83.5%, a difference of 0.020%), and Immigrants from Turkey (83.6%, a difference of 0.030%).
| Demographics | Rating | Rank | In Labor Force | Age 45-54 |
| Immigrants | Morocco | 99.0 /100 | #49 | Exceptional 83.6% |
| Immigrants | Greece | 98.8 /100 | #50 | Exceptional 83.6% |
| Immigrants | Turkey | 98.8 /100 | #51 | Exceptional 83.6% |
| Poles | 98.7 /100 | #52 | Exceptional 83.6% |
| Peruvians | 98.7 /100 | #53 | Exceptional 83.6% |
| Somalis | 98.7 /100 | #54 | Exceptional 83.5% |
| Macedonians | 98.7 /100 | #55 | Exceptional 83.5% |
| Immigrants | Peru | 98.6 /100 | #56 | Exceptional 83.5% |
| Paraguayans | 98.5 /100 | #57 | Exceptional 83.5% |
| Eastern Europeans | 98.5 /100 | #58 | Exceptional 83.5% |
| Bhutanese | 98.3 /100 | #59 | Exceptional 83.5% |
| Carpatho Rusyns | 98.3 /100 | #60 | Exceptional 83.5% |
| Filipinos | 98.3 /100 | #61 | Exceptional 83.5% |
| Immigrants | Taiwan | 98.0 /100 | #62 | Exceptional 83.5% |
| Afghans | 97.9 /100 | #63 | Exceptional 83.5% |