Immigrants from Eastern Europe vs Delaware In Labor Force | Age 45-54
COMPARE
Immigrants from Eastern Europe
Delaware
In Labor Force | Age 45-54
In Labor Force | Age 45-54 Comparison
Immigrants from Eastern Europe
Delaware
83.3%
IN LABOR FORCE | AGE 45-54
95.6/ 100
METRIC RATING
87th/ 347
METRIC RANK
80.8%
IN LABOR FORCE | AGE 45-54
0.0/ 100
METRIC RATING
285th/ 347
METRIC RANK
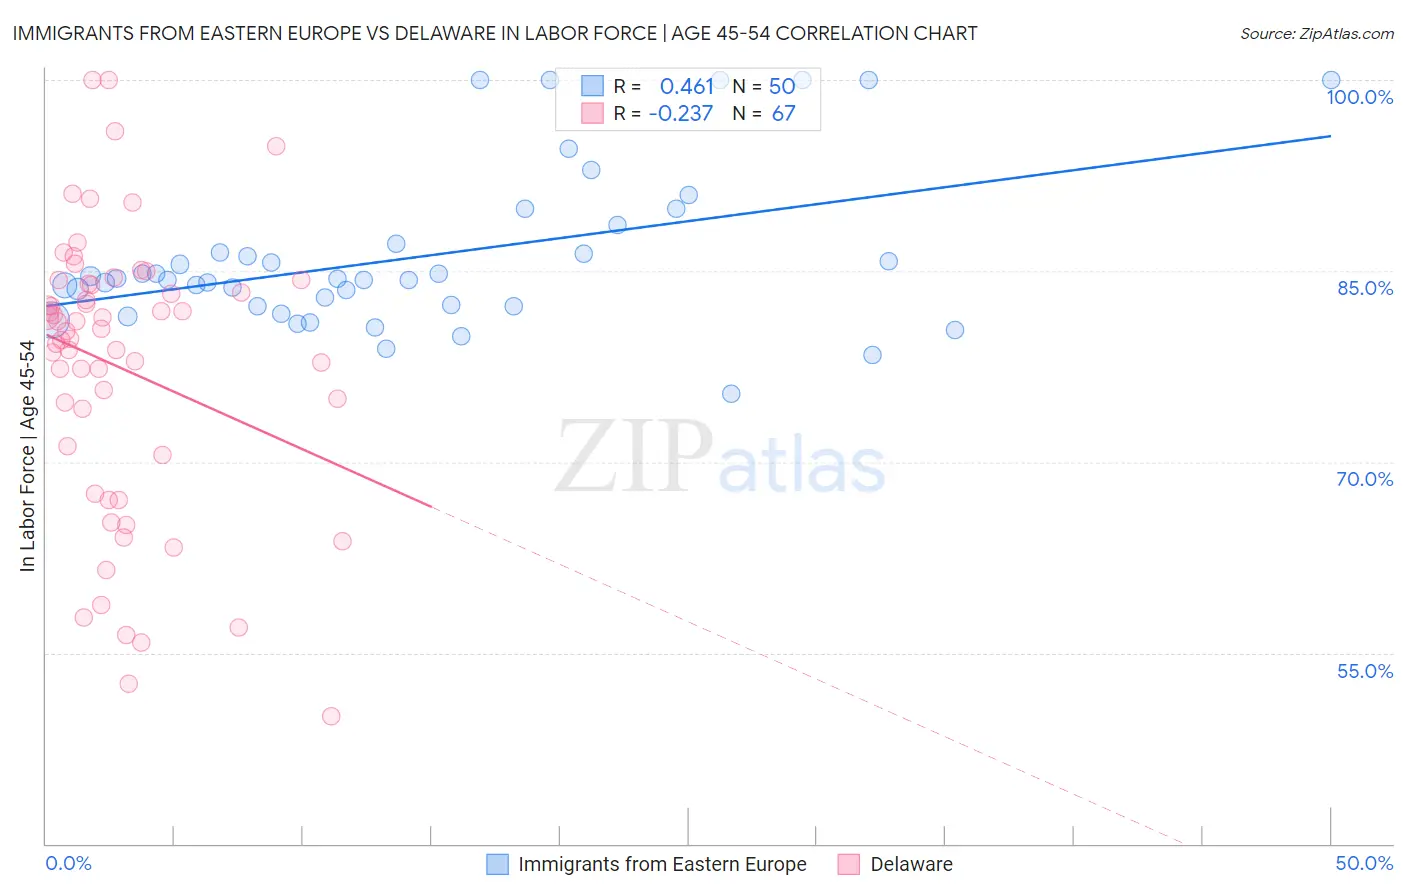
Immigrants from Eastern Europe vs Delaware In Labor Force | Age 45-54 Correlation Chart
The statistical analysis conducted on geographies consisting of 475,461,261 people shows a moderate positive correlation between the proportion of Immigrants from Eastern Europe and labor force participation rate among population between the ages 45 and 54 in the United States with a correlation coefficient (R) of 0.461 and weighted average of 83.3%. Similarly, the statistical analysis conducted on geographies consisting of 96,219,228 people shows a weak negative correlation between the proportion of Delaware and labor force participation rate among population between the ages 45 and 54 in the United States with a correlation coefficient (R) of -0.237 and weighted average of 80.8%, a difference of 3.2%.
In Labor Force | Age 45-54 Correlation Summary
| Measurement | Immigrants from Eastern Europe | Delaware |
| Minimum | 75.4% | 50.0% |
| Maximum | 100.0% | 100.0% |
| Range | 24.6% | 50.0% |
| Mean | 86.1% | 77.4% |
| Median | 84.4% | 80.2% |
| Interquartile 25% (IQ1) | 82.3% | 70.5% |
| Interquartile 75% (IQ3) | 87.1% | 84.0% |
| Interquartile Range (IQR) | 4.9% | 13.5% |
| Standard Deviation (Sample) | 6.2% | 11.1% |
| Standard Deviation (Population) | 6.2% | 11.0% |
Similar Demographics by In Labor Force | Age 45-54
Demographics Similar to Immigrants from Eastern Europe by In Labor Force | Age 45-54
In terms of in labor force | age 45-54, the demographic groups most similar to Immigrants from Eastern Europe are Immigrants from Northern Africa (83.3%, a difference of 0.0%), Immigrants from Asia (83.3%, a difference of 0.0%), Indian (Asian) (83.3%, a difference of 0.0%), Immigrants from Japan (83.3%, a difference of 0.0%), and South American (83.3%, a difference of 0.010%).
| Demographics | Rating | Rank | In Labor Force | Age 45-54 |
| Immigrants | Croatia | 96.5 /100 | #80 | Exceptional 83.4% |
| Jordanians | 96.4 /100 | #81 | Exceptional 83.4% |
| Immigrants | Eastern Asia | 96.3 /100 | #82 | Exceptional 83.4% |
| Immigrants | Zimbabwe | 96.3 /100 | #83 | Exceptional 83.4% |
| Immigrants | Bosnia and Herzegovina | 96.0 /100 | #84 | Exceptional 83.3% |
| Greeks | 95.9 /100 | #85 | Exceptional 83.3% |
| Immigrants | Northern Africa | 95.7 /100 | #86 | Exceptional 83.3% |
| Immigrants | Eastern Europe | 95.6 /100 | #87 | Exceptional 83.3% |
| Immigrants | Asia | 95.6 /100 | #88 | Exceptional 83.3% |
| Indians (Asian) | 95.5 /100 | #89 | Exceptional 83.3% |
| Immigrants | Japan | 95.5 /100 | #90 | Exceptional 83.3% |
| South Americans | 95.5 /100 | #91 | Exceptional 83.3% |
| Danes | 95.3 /100 | #92 | Exceptional 83.3% |
| Italians | 95.1 /100 | #93 | Exceptional 83.3% |
| Argentineans | 94.9 /100 | #94 | Exceptional 83.3% |
Demographics Similar to Delaware by In Labor Force | Age 45-54
In terms of in labor force | age 45-54, the demographic groups most similar to Delaware are Belizean (80.8%, a difference of 0.010%), Immigrants from Dominica (80.8%, a difference of 0.010%), Vietnamese (80.8%, a difference of 0.010%), Cree (80.8%, a difference of 0.010%), and Immigrants from Bangladesh (80.7%, a difference of 0.040%).
| Demographics | Rating | Rank | In Labor Force | Age 45-54 |
| Immigrants | Guatemala | 0.0 /100 | #278 | Tragic 81.1% |
| Immigrants | Micronesia | 0.0 /100 | #279 | Tragic 81.1% |
| Immigrants | Latin America | 0.0 /100 | #280 | Tragic 81.0% |
| Immigrants | Grenada | 0.0 /100 | #281 | Tragic 81.0% |
| Aleuts | 0.0 /100 | #282 | Tragic 81.0% |
| French American Indians | 0.0 /100 | #283 | Tragic 80.8% |
| Belizeans | 0.0 /100 | #284 | Tragic 80.8% |
| Delaware | 0.0 /100 | #285 | Tragic 80.8% |
| Immigrants | Dominica | 0.0 /100 | #286 | Tragic 80.8% |
| Vietnamese | 0.0 /100 | #287 | Tragic 80.8% |
| Cree | 0.0 /100 | #288 | Tragic 80.8% |
| Immigrants | Bangladesh | 0.0 /100 | #289 | Tragic 80.7% |
| Mexican American Indians | 0.0 /100 | #290 | Tragic 80.7% |
| Immigrants | Belize | 0.0 /100 | #291 | Tragic 80.6% |
| Iroquois | 0.0 /100 | #292 | Tragic 80.6% |