Scotch-Irish vs Immigrants from Peru In Labor Force | Age 45-54
COMPARE
Scotch-Irish
Immigrants from Peru
In Labor Force | Age 45-54
In Labor Force | Age 45-54 Comparison
Scotch-Irish
Immigrants from Peru
81.6%
IN LABOR FORCE | AGE 45-54
0.2/ 100
METRIC RATING
255th/ 347
METRIC RANK
83.5%
IN LABOR FORCE | AGE 45-54
98.6/ 100
METRIC RATING
56th/ 347
METRIC RANK
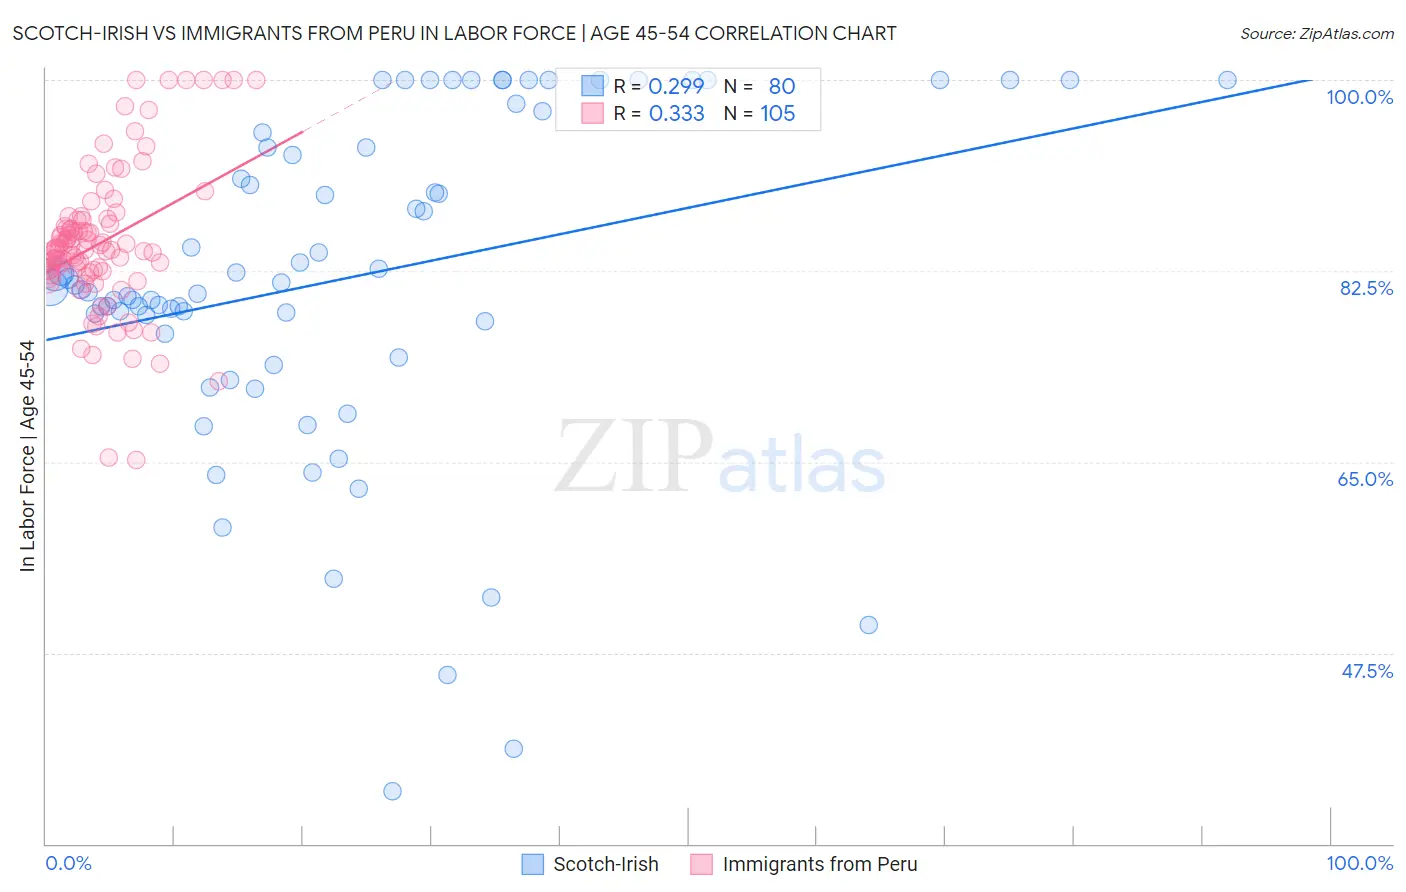
Scotch-Irish vs Immigrants from Peru In Labor Force | Age 45-54 Correlation Chart
The statistical analysis conducted on geographies consisting of 548,273,323 people shows a weak positive correlation between the proportion of Scotch-Irish and labor force participation rate among population between the ages 45 and 54 in the United States with a correlation coefficient (R) of 0.299 and weighted average of 81.6%. Similarly, the statistical analysis conducted on geographies consisting of 328,756,555 people shows a mild positive correlation between the proportion of Immigrants from Peru and labor force participation rate among population between the ages 45 and 54 in the United States with a correlation coefficient (R) of 0.333 and weighted average of 83.5%, a difference of 2.4%.
In Labor Force | Age 45-54 Correlation Summary
| Measurement | Scotch-Irish | Immigrants from Peru |
| Minimum | 34.8% | 65.1% |
| Maximum | 100.0% | 100.0% |
| Range | 65.2% | 34.9% |
| Mean | 81.9% | 85.1% |
| Median | 81.1% | 84.5% |
| Interquartile 25% (IQ1) | 77.3% | 82.4% |
| Interquartile 75% (IQ3) | 94.5% | 87.2% |
| Interquartile Range (IQR) | 17.2% | 4.7% |
| Standard Deviation (Sample) | 15.1% | 6.6% |
| Standard Deviation (Population) | 15.0% | 6.6% |
Similar Demographics by In Labor Force | Age 45-54
Demographics Similar to Scotch-Irish by In Labor Force | Age 45-54
In terms of in labor force | age 45-54, the demographic groups most similar to Scotch-Irish are Japanese (81.6%, a difference of 0.020%), Immigrants from Laos (81.6%, a difference of 0.020%), Barbadian (81.6%, a difference of 0.030%), Pennsylvania German (81.6%, a difference of 0.050%), and Immigrants from Congo (81.6%, a difference of 0.050%).
| Demographics | Rating | Rank | In Labor Force | Age 45-54 |
| Puget Sound Salish | 0.3 /100 | #248 | Tragic 81.7% |
| Hmong | 0.3 /100 | #249 | Tragic 81.7% |
| Immigrants | Armenia | 0.2 /100 | #250 | Tragic 81.7% |
| Guamanians/Chamorros | 0.2 /100 | #251 | Tragic 81.6% |
| Pennsylvania Germans | 0.2 /100 | #252 | Tragic 81.6% |
| Japanese | 0.2 /100 | #253 | Tragic 81.6% |
| Immigrants | Laos | 0.2 /100 | #254 | Tragic 81.6% |
| Scotch-Irish | 0.2 /100 | #255 | Tragic 81.6% |
| Barbadians | 0.1 /100 | #256 | Tragic 81.6% |
| Immigrants | Congo | 0.1 /100 | #257 | Tragic 81.6% |
| Immigrants | Fiji | 0.1 /100 | #258 | Tragic 81.5% |
| Guyanese | 0.1 /100 | #259 | Tragic 81.5% |
| Spaniards | 0.1 /100 | #260 | Tragic 81.5% |
| Hawaiians | 0.1 /100 | #261 | Tragic 81.5% |
| Immigrants | Guyana | 0.1 /100 | #262 | Tragic 81.5% |
Demographics Similar to Immigrants from Peru by In Labor Force | Age 45-54
In terms of in labor force | age 45-54, the demographic groups most similar to Immigrants from Peru are Paraguayan (83.5%, a difference of 0.010%), Somali (83.5%, a difference of 0.020%), Macedonian (83.5%, a difference of 0.020%), Eastern European (83.5%, a difference of 0.020%), and Immigrants from Turkey (83.6%, a difference of 0.030%).
| Demographics | Rating | Rank | In Labor Force | Age 45-54 |
| Immigrants | Morocco | 99.0 /100 | #49 | Exceptional 83.6% |
| Immigrants | Greece | 98.8 /100 | #50 | Exceptional 83.6% |
| Immigrants | Turkey | 98.8 /100 | #51 | Exceptional 83.6% |
| Poles | 98.7 /100 | #52 | Exceptional 83.6% |
| Peruvians | 98.7 /100 | #53 | Exceptional 83.6% |
| Somalis | 98.7 /100 | #54 | Exceptional 83.5% |
| Macedonians | 98.7 /100 | #55 | Exceptional 83.5% |
| Immigrants | Peru | 98.6 /100 | #56 | Exceptional 83.5% |
| Paraguayans | 98.5 /100 | #57 | Exceptional 83.5% |
| Eastern Europeans | 98.5 /100 | #58 | Exceptional 83.5% |
| Bhutanese | 98.3 /100 | #59 | Exceptional 83.5% |
| Carpatho Rusyns | 98.3 /100 | #60 | Exceptional 83.5% |
| Filipinos | 98.3 /100 | #61 | Exceptional 83.5% |
| Immigrants | Taiwan | 98.0 /100 | #62 | Exceptional 83.5% |
| Afghans | 97.9 /100 | #63 | Exceptional 83.5% |