Immigrants from Eastern Europe vs Immigrants from Latvia In Labor Force | Age 45-54
COMPARE
Immigrants from Eastern Europe
Immigrants from Latvia
In Labor Force | Age 45-54
In Labor Force | Age 45-54 Comparison
Immigrants from Eastern Europe
Immigrants from Latvia
83.3%
IN LABOR FORCE | AGE 45-54
95.6/ 100
METRIC RATING
87th/ 347
METRIC RANK
83.4%
IN LABOR FORCE | AGE 45-54
97.4/ 100
METRIC RATING
70th/ 347
METRIC RANK
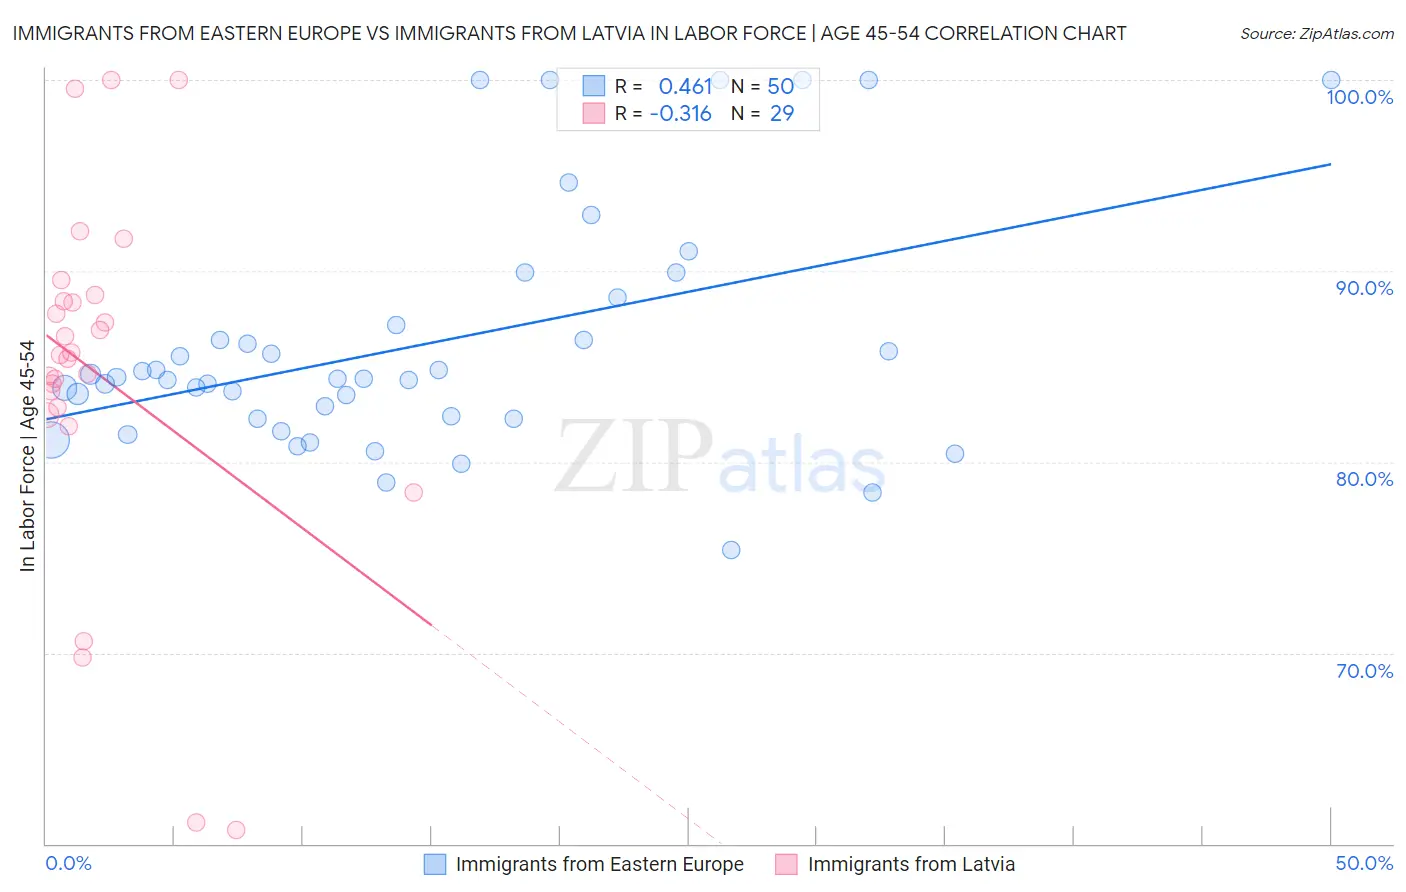
Immigrants from Eastern Europe vs Immigrants from Latvia In Labor Force | Age 45-54 Correlation Chart
The statistical analysis conducted on geographies consisting of 475,461,261 people shows a moderate positive correlation between the proportion of Immigrants from Eastern Europe and labor force participation rate among population between the ages 45 and 54 in the United States with a correlation coefficient (R) of 0.461 and weighted average of 83.3%. Similarly, the statistical analysis conducted on geographies consisting of 113,723,601 people shows a mild negative correlation between the proportion of Immigrants from Latvia and labor force participation rate among population between the ages 45 and 54 in the United States with a correlation coefficient (R) of -0.316 and weighted average of 83.4%, a difference of 0.12%.
In Labor Force | Age 45-54 Correlation Summary
| Measurement | Immigrants from Eastern Europe | Immigrants from Latvia |
| Minimum | 75.4% | 60.7% |
| Maximum | 100.0% | 100.0% |
| Range | 24.6% | 39.3% |
| Mean | 86.1% | 84.6% |
| Median | 84.4% | 85.6% |
| Interquartile 25% (IQ1) | 82.3% | 82.6% |
| Interquartile 75% (IQ3) | 87.1% | 88.6% |
| Interquartile Range (IQR) | 4.9% | 5.9% |
| Standard Deviation (Sample) | 6.2% | 9.4% |
| Standard Deviation (Population) | 6.2% | 9.3% |
Demographics Similar to Immigrants from Eastern Europe and Immigrants from Latvia by In Labor Force | Age 45-54
In terms of in labor force | age 45-54, the demographic groups most similar to Immigrants from Eastern Europe are Immigrants from Northern Africa (83.3%, a difference of 0.0%), Immigrants from Asia (83.3%, a difference of 0.0%), Immigrants from Bosnia and Herzegovina (83.3%, a difference of 0.020%), Greek (83.3%, a difference of 0.020%), and Immigrants from Eastern Asia (83.4%, a difference of 0.040%). Similarly, the demographic groups most similar to Immigrants from Latvia are Colombian (83.4%, a difference of 0.0%), Taiwanese (83.4%, a difference of 0.010%), Immigrants from Colombia (83.4%, a difference of 0.020%), Serbian (83.4%, a difference of 0.020%), and Immigrants from Czechoslovakia (83.4%, a difference of 0.020%).
| Demographics | Rating | Rank | In Labor Force | Age 45-54 |
| Immigrants | Colombia | 97.6 /100 | #68 | Exceptional 83.4% |
| Taiwanese | 97.5 /100 | #69 | Exceptional 83.4% |
| Immigrants | Latvia | 97.4 /100 | #70 | Exceptional 83.4% |
| Colombians | 97.3 /100 | #71 | Exceptional 83.4% |
| Serbians | 97.2 /100 | #72 | Exceptional 83.4% |
| Immigrants | Czechoslovakia | 97.1 /100 | #73 | Exceptional 83.4% |
| Immigrants | Somalia | 96.9 /100 | #74 | Exceptional 83.4% |
| Estonians | 96.9 /100 | #75 | Exceptional 83.4% |
| Russians | 96.8 /100 | #76 | Exceptional 83.4% |
| Cubans | 96.7 /100 | #77 | Exceptional 83.4% |
| Immigrants | Egypt | 96.6 /100 | #78 | Exceptional 83.4% |
| Belgians | 96.5 /100 | #79 | Exceptional 83.4% |
| Immigrants | Croatia | 96.5 /100 | #80 | Exceptional 83.4% |
| Jordanians | 96.4 /100 | #81 | Exceptional 83.4% |
| Immigrants | Eastern Asia | 96.3 /100 | #82 | Exceptional 83.4% |
| Immigrants | Zimbabwe | 96.3 /100 | #83 | Exceptional 83.4% |
| Immigrants | Bosnia and Herzegovina | 96.0 /100 | #84 | Exceptional 83.3% |
| Greeks | 95.9 /100 | #85 | Exceptional 83.3% |
| Immigrants | Northern Africa | 95.7 /100 | #86 | Exceptional 83.3% |
| Immigrants | Eastern Europe | 95.6 /100 | #87 | Exceptional 83.3% |
| Immigrants | Asia | 95.6 /100 | #88 | Exceptional 83.3% |