Malaysian vs Immigrants from Peru In Labor Force | Age 45-54
COMPARE
Malaysian
Immigrants from Peru
In Labor Force | Age 45-54
In Labor Force | Age 45-54 Comparison
Malaysians
Immigrants from Peru
82.0%
IN LABOR FORCE | AGE 45-54
1.7/ 100
METRIC RATING
233rd/ 347
METRIC RANK
83.5%
IN LABOR FORCE | AGE 45-54
98.6/ 100
METRIC RATING
56th/ 347
METRIC RANK
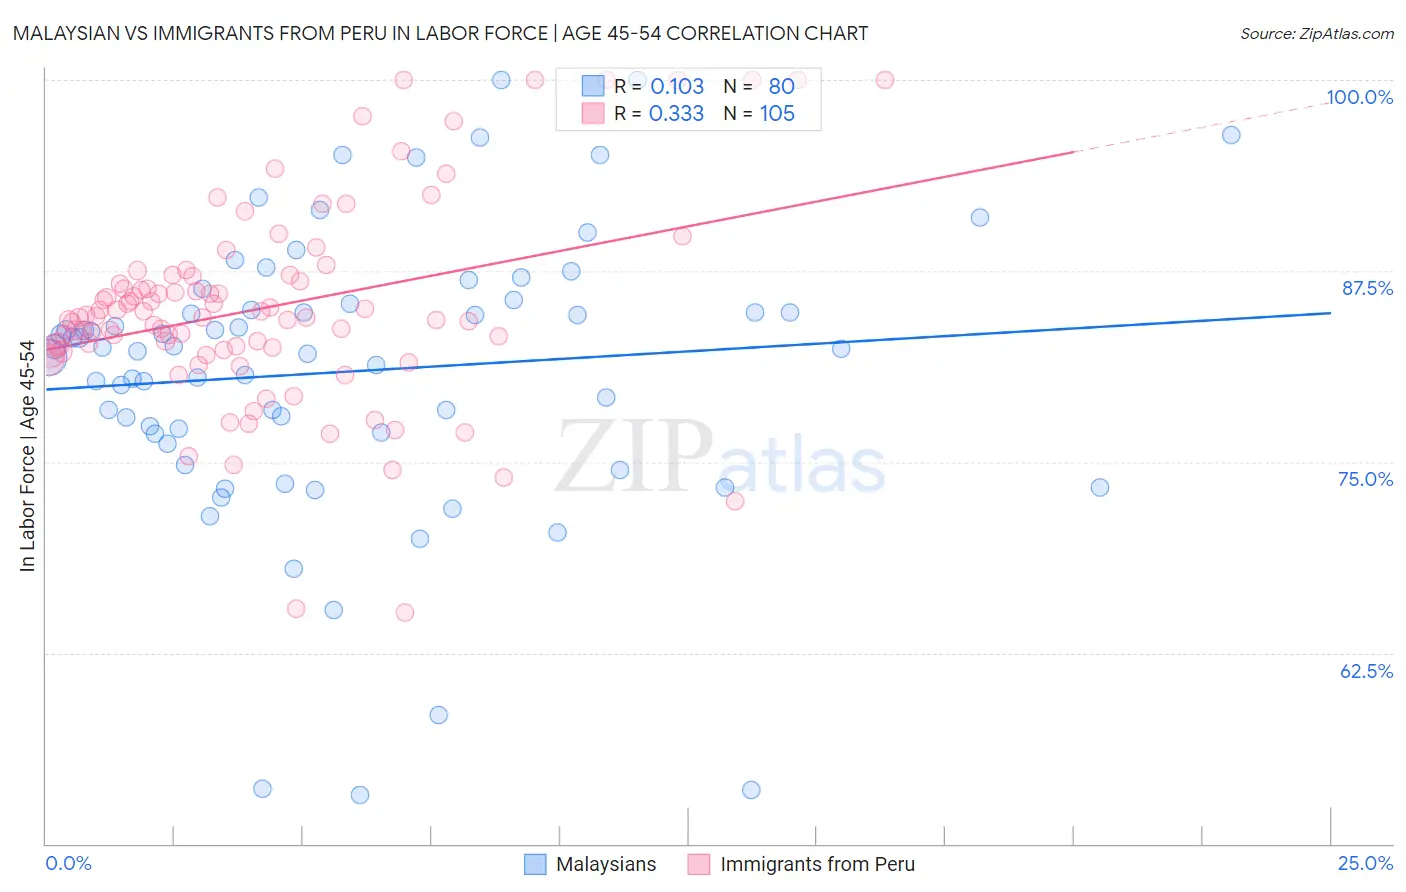
Malaysian vs Immigrants from Peru In Labor Force | Age 45-54 Correlation Chart
The statistical analysis conducted on geographies consisting of 226,006,584 people shows a poor positive correlation between the proportion of Malaysians and labor force participation rate among population between the ages 45 and 54 in the United States with a correlation coefficient (R) of 0.103 and weighted average of 82.0%. Similarly, the statistical analysis conducted on geographies consisting of 328,756,555 people shows a mild positive correlation between the proportion of Immigrants from Peru and labor force participation rate among population between the ages 45 and 54 in the United States with a correlation coefficient (R) of 0.333 and weighted average of 83.5%, a difference of 1.8%.
In Labor Force | Age 45-54 Correlation Summary
| Measurement | Malaysian | Immigrants from Peru |
| Minimum | 53.2% | 65.1% |
| Maximum | 100.0% | 100.0% |
| Range | 46.8% | 34.9% |
| Mean | 80.9% | 85.1% |
| Median | 82.4% | 84.5% |
| Interquartile 25% (IQ1) | 76.9% | 82.4% |
| Interquartile 75% (IQ3) | 85.1% | 87.2% |
| Interquartile Range (IQR) | 8.3% | 4.7% |
| Standard Deviation (Sample) | 9.3% | 6.6% |
| Standard Deviation (Population) | 9.3% | 6.6% |
Similar Demographics by In Labor Force | Age 45-54
Demographics Similar to Malaysians by In Labor Force | Age 45-54
In terms of in labor force | age 45-54, the demographic groups most similar to Malaysians are Immigrants from Portugal (82.0%, a difference of 0.0%), Salvadoran (82.0%, a difference of 0.0%), Immigrants from Senegal (82.0%, a difference of 0.010%), Jamaican (82.0%, a difference of 0.020%), and Immigrants from Burma/Myanmar (82.0%, a difference of 0.030%).
| Demographics | Rating | Rank | In Labor Force | Age 45-54 |
| Immigrants | Caribbean | 2.5 /100 | #226 | Tragic 82.1% |
| Immigrants | Germany | 2.4 /100 | #227 | Tragic 82.1% |
| Cape Verdeans | 2.1 /100 | #228 | Tragic 82.1% |
| Immigrants | Burma/Myanmar | 1.9 /100 | #229 | Tragic 82.0% |
| Jamaicans | 1.8 /100 | #230 | Tragic 82.0% |
| Immigrants | Senegal | 1.7 /100 | #231 | Tragic 82.0% |
| Immigrants | Portugal | 1.7 /100 | #232 | Tragic 82.0% |
| Malaysians | 1.7 /100 | #233 | Tragic 82.0% |
| Salvadorans | 1.7 /100 | #234 | Tragic 82.0% |
| Sub-Saharan Africans | 1.2 /100 | #235 | Tragic 82.0% |
| Basques | 1.2 /100 | #236 | Tragic 82.0% |
| Immigrants | Trinidad and Tobago | 1.2 /100 | #237 | Tragic 82.0% |
| Trinidadians and Tobagonians | 1.1 /100 | #238 | Tragic 81.9% |
| Immigrants | Thailand | 1.0 /100 | #239 | Tragic 81.9% |
| Immigrants | El Salvador | 1.0 /100 | #240 | Tragic 81.9% |
Demographics Similar to Immigrants from Peru by In Labor Force | Age 45-54
In terms of in labor force | age 45-54, the demographic groups most similar to Immigrants from Peru are Paraguayan (83.5%, a difference of 0.010%), Somali (83.5%, a difference of 0.020%), Macedonian (83.5%, a difference of 0.020%), Eastern European (83.5%, a difference of 0.020%), and Immigrants from Turkey (83.6%, a difference of 0.030%).
| Demographics | Rating | Rank | In Labor Force | Age 45-54 |
| Immigrants | Morocco | 99.0 /100 | #49 | Exceptional 83.6% |
| Immigrants | Greece | 98.8 /100 | #50 | Exceptional 83.6% |
| Immigrants | Turkey | 98.8 /100 | #51 | Exceptional 83.6% |
| Poles | 98.7 /100 | #52 | Exceptional 83.6% |
| Peruvians | 98.7 /100 | #53 | Exceptional 83.6% |
| Somalis | 98.7 /100 | #54 | Exceptional 83.5% |
| Macedonians | 98.7 /100 | #55 | Exceptional 83.5% |
| Immigrants | Peru | 98.6 /100 | #56 | Exceptional 83.5% |
| Paraguayans | 98.5 /100 | #57 | Exceptional 83.5% |
| Eastern Europeans | 98.5 /100 | #58 | Exceptional 83.5% |
| Bhutanese | 98.3 /100 | #59 | Exceptional 83.5% |
| Carpatho Rusyns | 98.3 /100 | #60 | Exceptional 83.5% |
| Filipinos | 98.3 /100 | #61 | Exceptional 83.5% |
| Immigrants | Taiwan | 98.0 /100 | #62 | Exceptional 83.5% |
| Afghans | 97.9 /100 | #63 | Exceptional 83.5% |