Immigrants from Eastern Europe vs Immigrants from Korea In Labor Force | Age 45-54
COMPARE
Immigrants from Eastern Europe
Immigrants from Korea
In Labor Force | Age 45-54
In Labor Force | Age 45-54 Comparison
Immigrants from Eastern Europe
Immigrants from Korea
83.3%
IN LABOR FORCE | AGE 45-54
95.6/ 100
METRIC RATING
87th/ 347
METRIC RANK
83.7%
IN LABOR FORCE | AGE 45-54
99.3/ 100
METRIC RATING
41st/ 347
METRIC RANK
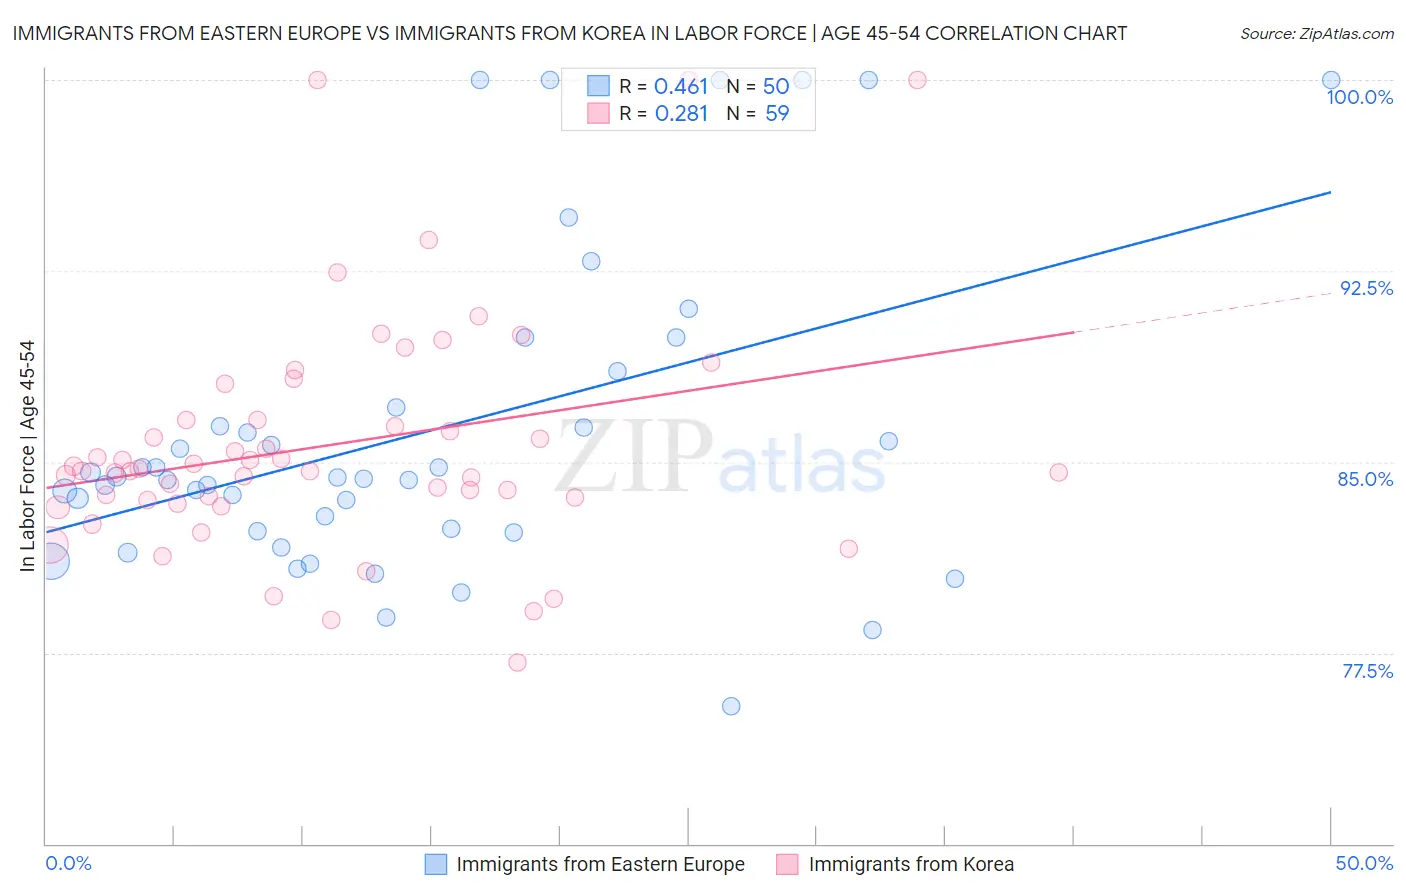
Immigrants from Eastern Europe vs Immigrants from Korea In Labor Force | Age 45-54 Correlation Chart
The statistical analysis conducted on geographies consisting of 475,461,261 people shows a moderate positive correlation between the proportion of Immigrants from Eastern Europe and labor force participation rate among population between the ages 45 and 54 in the United States with a correlation coefficient (R) of 0.461 and weighted average of 83.3%. Similarly, the statistical analysis conducted on geographies consisting of 415,943,444 people shows a weak positive correlation between the proportion of Immigrants from Korea and labor force participation rate among population between the ages 45 and 54 in the United States with a correlation coefficient (R) of 0.281 and weighted average of 83.7%, a difference of 0.42%.
In Labor Force | Age 45-54 Correlation Summary
| Measurement | Immigrants from Eastern Europe | Immigrants from Korea |
| Minimum | 75.4% | 77.1% |
| Maximum | 100.0% | 100.0% |
| Range | 24.6% | 22.9% |
| Mean | 86.1% | 85.7% |
| Median | 84.4% | 84.7% |
| Interquartile 25% (IQ1) | 82.3% | 83.5% |
| Interquartile 75% (IQ3) | 87.1% | 86.7% |
| Interquartile Range (IQR) | 4.9% | 3.2% |
| Standard Deviation (Sample) | 6.2% | 4.6% |
| Standard Deviation (Population) | 6.2% | 4.6% |
Similar Demographics by In Labor Force | Age 45-54
Demographics Similar to Immigrants from Eastern Europe by In Labor Force | Age 45-54
In terms of in labor force | age 45-54, the demographic groups most similar to Immigrants from Eastern Europe are Immigrants from Northern Africa (83.3%, a difference of 0.0%), Immigrants from Asia (83.3%, a difference of 0.0%), Indian (Asian) (83.3%, a difference of 0.0%), Immigrants from Japan (83.3%, a difference of 0.0%), and South American (83.3%, a difference of 0.010%).
| Demographics | Rating | Rank | In Labor Force | Age 45-54 |
| Immigrants | Croatia | 96.5 /100 | #80 | Exceptional 83.4% |
| Jordanians | 96.4 /100 | #81 | Exceptional 83.4% |
| Immigrants | Eastern Asia | 96.3 /100 | #82 | Exceptional 83.4% |
| Immigrants | Zimbabwe | 96.3 /100 | #83 | Exceptional 83.4% |
| Immigrants | Bosnia and Herzegovina | 96.0 /100 | #84 | Exceptional 83.3% |
| Greeks | 95.9 /100 | #85 | Exceptional 83.3% |
| Immigrants | Northern Africa | 95.7 /100 | #86 | Exceptional 83.3% |
| Immigrants | Eastern Europe | 95.6 /100 | #87 | Exceptional 83.3% |
| Immigrants | Asia | 95.6 /100 | #88 | Exceptional 83.3% |
| Indians (Asian) | 95.5 /100 | #89 | Exceptional 83.3% |
| Immigrants | Japan | 95.5 /100 | #90 | Exceptional 83.3% |
| South Americans | 95.5 /100 | #91 | Exceptional 83.3% |
| Danes | 95.3 /100 | #92 | Exceptional 83.3% |
| Italians | 95.1 /100 | #93 | Exceptional 83.3% |
| Argentineans | 94.9 /100 | #94 | Exceptional 83.3% |
Demographics Similar to Immigrants from Korea by In Labor Force | Age 45-54
In terms of in labor force | age 45-54, the demographic groups most similar to Immigrants from Korea are Immigrants from Moldova (83.7%, a difference of 0.0%), Immigrants from Uganda (83.7%, a difference of 0.010%), Immigrants from Venezuela (83.7%, a difference of 0.020%), Immigrants from Cuba (83.7%, a difference of 0.020%), and Swedish (83.7%, a difference of 0.030%).
| Demographics | Rating | Rank | In Labor Force | Age 45-54 |
| Kenyans | 99.5 /100 | #34 | Exceptional 83.7% |
| Brazilians | 99.5 /100 | #35 | Exceptional 83.7% |
| Ugandans | 99.5 /100 | #36 | Exceptional 83.7% |
| Swedes | 99.4 /100 | #37 | Exceptional 83.7% |
| Immigrants | Venezuela | 99.4 /100 | #38 | Exceptional 83.7% |
| Immigrants | Cuba | 99.4 /100 | #39 | Exceptional 83.7% |
| Immigrants | Uganda | 99.4 /100 | #40 | Exceptional 83.7% |
| Immigrants | Korea | 99.3 /100 | #41 | Exceptional 83.7% |
| Immigrants | Moldova | 99.3 /100 | #42 | Exceptional 83.7% |
| Venezuelans | 99.2 /100 | #43 | Exceptional 83.6% |
| Burmese | 99.1 /100 | #44 | Exceptional 83.6% |
| Immigrants | Hong Kong | 99.1 /100 | #45 | Exceptional 83.6% |
| Lithuanians | 99.1 /100 | #46 | Exceptional 83.6% |
| Croatians | 99.0 /100 | #47 | Exceptional 83.6% |
| Immigrants | Poland | 99.0 /100 | #48 | Exceptional 83.6% |