Immigrants from Eastern Europe vs Immigrants from Peru Unemployment Among Ages 55 to 59 years
COMPARE
Immigrants from Eastern Europe
Immigrants from Peru
Unemployment Among Ages 55 to 59 years
Unemployment Among Ages 55 to 59 years Comparison
Immigrants from Eastern Europe
Immigrants from Peru
4.8%
UNEMPLOYMENT AMONG AGES 55 TO 59 YEARS
52.2/ 100
METRIC RATING
173rd/ 347
METRIC RANK
4.8%
UNEMPLOYMENT AMONG AGES 55 TO 59 YEARS
38.6/ 100
METRIC RATING
183rd/ 347
METRIC RANK
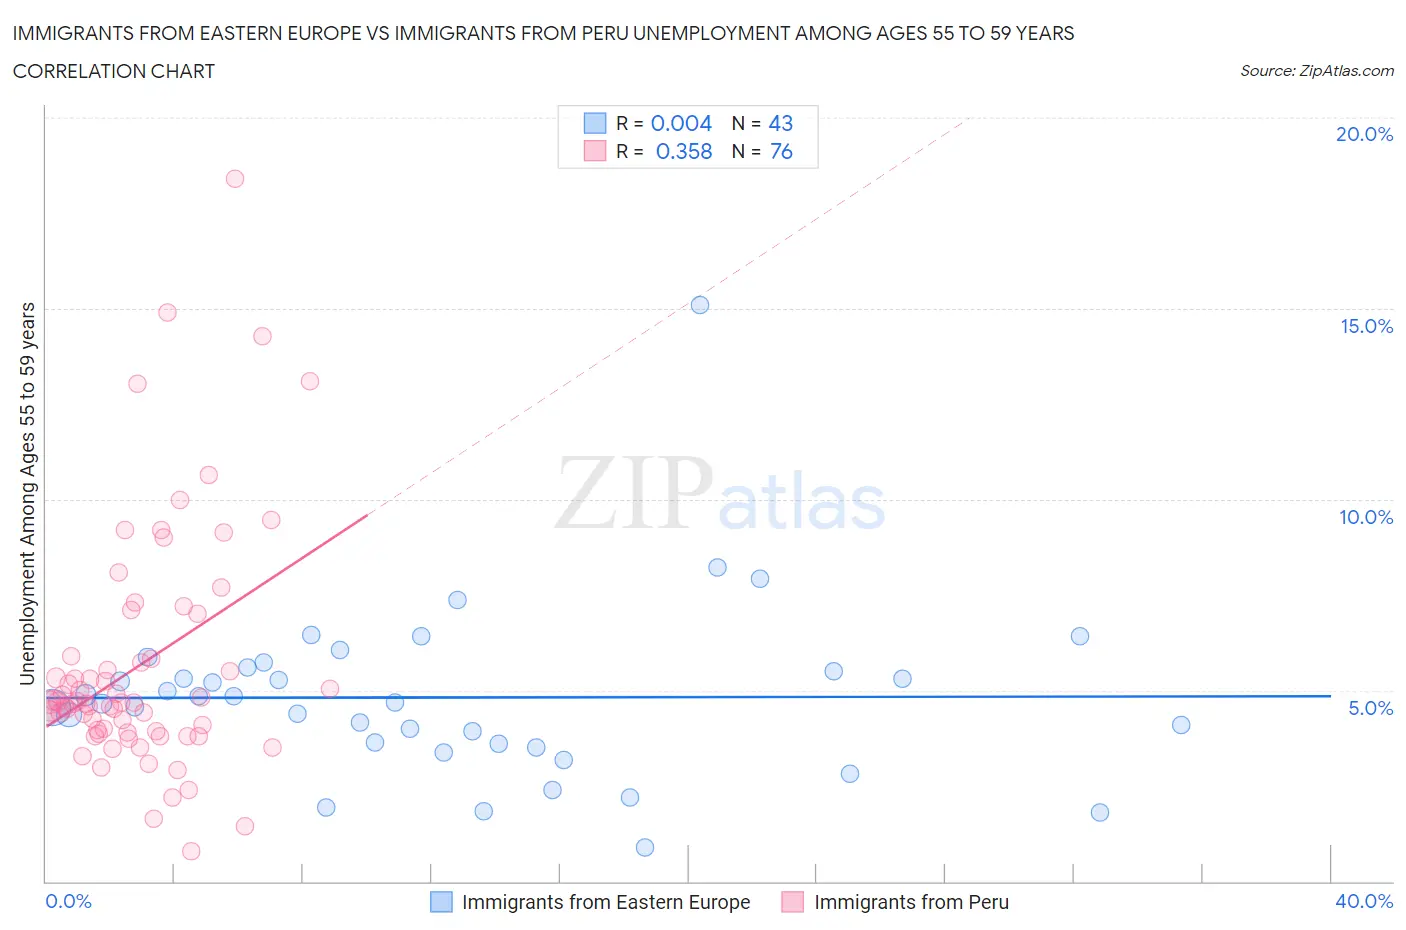
Immigrants from Eastern Europe vs Immigrants from Peru Unemployment Among Ages 55 to 59 years Correlation Chart
The statistical analysis conducted on geographies consisting of 431,977,096 people shows no correlation between the proportion of Immigrants from Eastern Europe and unemployment rate among population between the ages 55 and 59 in the United States with a correlation coefficient (R) of 0.004 and weighted average of 4.8%. Similarly, the statistical analysis conducted on geographies consisting of 313,256,453 people shows a mild positive correlation between the proportion of Immigrants from Peru and unemployment rate among population between the ages 55 and 59 in the United States with a correlation coefficient (R) of 0.358 and weighted average of 4.8%, a difference of 0.56%.
Unemployment Among Ages 55 to 59 years Correlation Summary
| Measurement | Immigrants from Eastern Europe | Immigrants from Peru |
| Minimum | 0.90% | 0.80% |
| Maximum | 15.1% | 18.4% |
| Range | 14.2% | 17.6% |
| Mean | 4.8% | 5.6% |
| Median | 4.7% | 4.7% |
| Interquartile 25% (IQ1) | 3.6% | 3.9% |
| Interquartile 75% (IQ3) | 5.6% | 5.9% |
| Interquartile Range (IQR) | 2.0% | 1.9% |
| Standard Deviation (Sample) | 2.3% | 3.1% |
| Standard Deviation (Population) | 2.2% | 3.1% |
Demographics Similar to Immigrants from Eastern Europe and Immigrants from Peru by Unemployment Among Ages 55 to 59 years
In terms of unemployment among ages 55 to 59 years, the demographic groups most similar to Immigrants from Eastern Europe are Nicaraguan (4.8%, a difference of 0.070%), Japanese (4.8%, a difference of 0.090%), Immigrants from Croatia (4.8%, a difference of 0.090%), Uruguayan (4.8%, a difference of 0.14%), and Australian (4.8%, a difference of 0.15%). Similarly, the demographic groups most similar to Immigrants from Peru are Immigrants from Czechoslovakia (4.8%, a difference of 0.020%), Immigrants from Hungary (4.8%, a difference of 0.070%), Immigrants from Europe (4.8%, a difference of 0.070%), Peruvian (4.8%, a difference of 0.070%), and Osage (4.8%, a difference of 0.070%).
| Demographics | Rating | Rank | Unemployment Among Ages 55 to 59 years |
| Immigrants | Cambodia | 59.3 /100 | #168 | Average 4.8% |
| Immigrants | Sudan | 58.4 /100 | #169 | Average 4.8% |
| Uruguayans | 55.6 /100 | #170 | Average 4.8% |
| Japanese | 54.5 /100 | #171 | Average 4.8% |
| Nicaraguans | 54.0 /100 | #172 | Average 4.8% |
| Immigrants | Eastern Europe | 52.2 /100 | #173 | Average 4.8% |
| Immigrants | Croatia | 50.0 /100 | #174 | Average 4.8% |
| Australians | 48.6 /100 | #175 | Average 4.8% |
| Samoans | 47.1 /100 | #176 | Average 4.8% |
| Immigrants | Sri Lanka | 46.8 /100 | #177 | Average 4.8% |
| Arabs | 44.7 /100 | #178 | Average 4.8% |
| Hungarians | 44.3 /100 | #179 | Average 4.8% |
| South Americans | 44.0 /100 | #180 | Average 4.8% |
| Immigrants | Hungary | 40.4 /100 | #181 | Average 4.8% |
| Immigrants | Europe | 40.4 /100 | #182 | Average 4.8% |
| Immigrants | Peru | 38.6 /100 | #183 | Fair 4.8% |
| Immigrants | Czechoslovakia | 38.0 /100 | #184 | Fair 4.8% |
| Peruvians | 37.0 /100 | #185 | Fair 4.8% |
| Osage | 37.0 /100 | #186 | Fair 4.8% |
| Immigrants | Morocco | 36.5 /100 | #187 | Fair 4.8% |
| Immigrants | Eastern Asia | 36.1 /100 | #188 | Fair 4.8% |