Immigrants from Eastern Africa vs Immigrants from Dominica Householder Income Ages 45 - 64 years
COMPARE
Immigrants from Eastern Africa
Immigrants from Dominica
Householder Income Ages 45 - 64 years
Householder Income Ages 45 - 64 years Comparison
Immigrants from Eastern Africa
Immigrants from Dominica
$98,467
HOUSEHOLDER INCOME AGES 45 - 64 YEARS
28.3/ 100
METRIC RATING
196th/ 347
METRIC RANK
$83,311
HOUSEHOLDER INCOME AGES 45 - 64 YEARS
0.0/ 100
METRIC RATING
309th/ 347
METRIC RANK
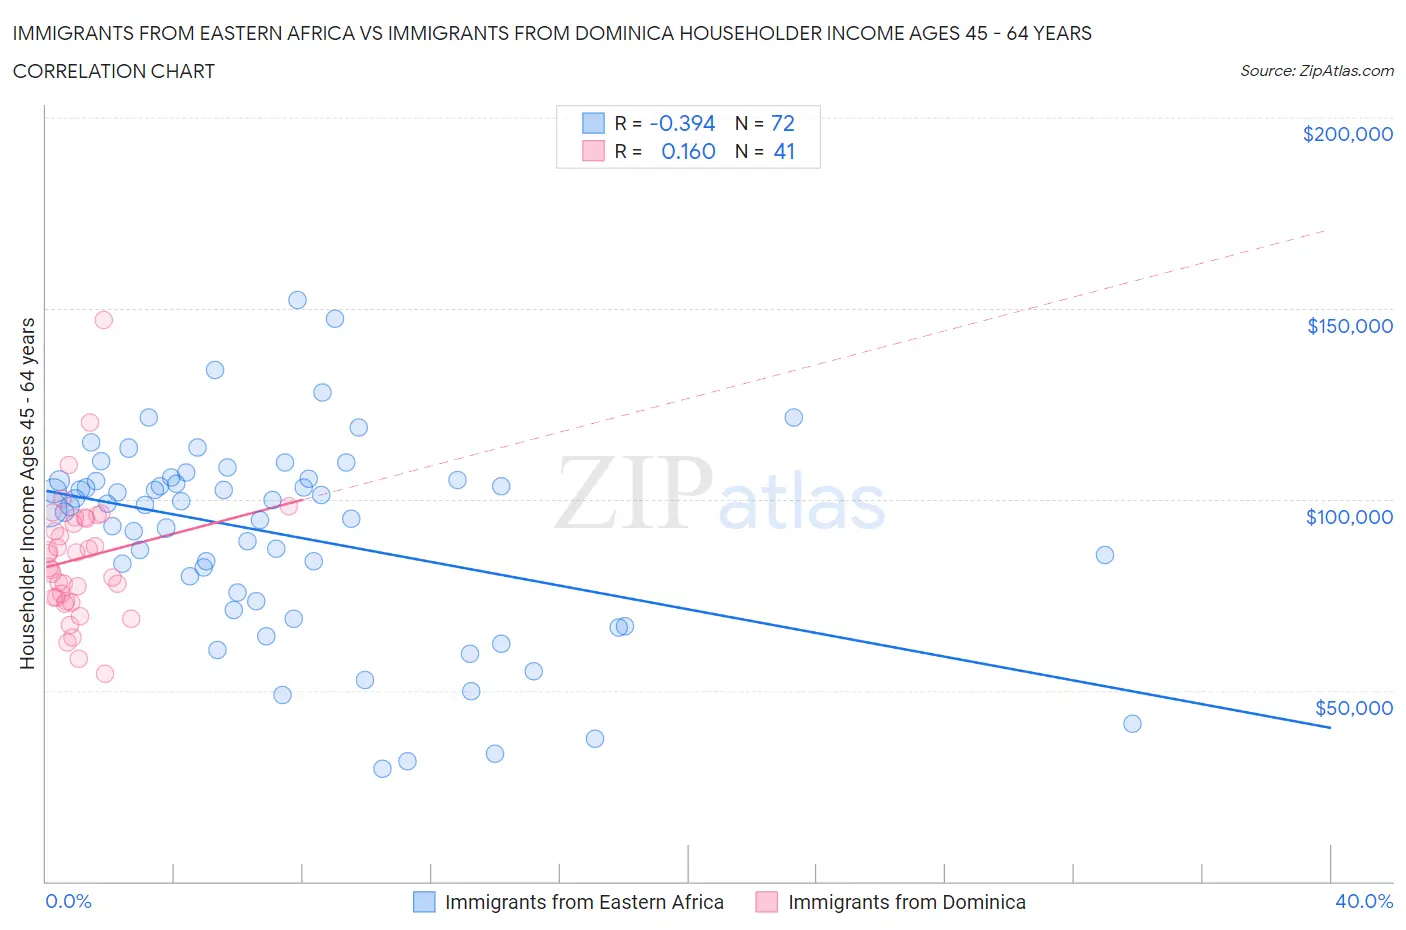
Immigrants from Eastern Africa vs Immigrants from Dominica Householder Income Ages 45 - 64 years Correlation Chart
The statistical analysis conducted on geographies consisting of 354,576,754 people shows a mild negative correlation between the proportion of Immigrants from Eastern Africa and household income with householder between the ages 45 and 64 in the United States with a correlation coefficient (R) of -0.394 and weighted average of $98,467. Similarly, the statistical analysis conducted on geographies consisting of 83,752,820 people shows a poor positive correlation between the proportion of Immigrants from Dominica and household income with householder between the ages 45 and 64 in the United States with a correlation coefficient (R) of 0.160 and weighted average of $83,311, a difference of 18.2%.
Householder Income Ages 45 - 64 years Correlation Summary
| Measurement | Immigrants from Eastern Africa | Immigrants from Dominica |
| Minimum | $29,590 | $54,250 |
| Maximum | $152,098 | $147,083 |
| Range | $122,508 | $92,833 |
| Mean | $90,687 | $84,539 |
| Median | $98,438 | $82,174 |
| Interquartile 25% (IQ1) | $74,490 | $73,845 |
| Interquartile 75% (IQ3) | $104,938 | $95,001 |
| Interquartile Range (IQR) | $30,447 | $21,156 |
| Standard Deviation (Sample) | $25,936 | $16,874 |
| Standard Deviation (Population) | $25,755 | $16,667 |
Similar Demographics by Householder Income Ages 45 - 64 years
Demographics Similar to Immigrants from Eastern Africa by Householder Income Ages 45 - 64 years
In terms of householder income ages 45 - 64 years, the demographic groups most similar to Immigrants from Eastern Africa are Spanish ($98,554, a difference of 0.090%), Puget Sound Salish ($98,340, a difference of 0.13%), Uruguayan ($98,660, a difference of 0.20%), Immigrants from Iraq ($98,201, a difference of 0.27%), and Hawaiian ($98,778, a difference of 0.32%).
| Demographics | Rating | Rank | Householder Income Ages 45 - 64 years |
| Immigrants | South America | 35.4 /100 | #189 | Fair $99,126 |
| French Canadians | 35.1 /100 | #190 | Fair $99,093 |
| Kenyans | 33.7 /100 | #191 | Fair $98,970 |
| Celtics | 32.9 /100 | #192 | Fair $98,896 |
| Hawaiians | 31.6 /100 | #193 | Fair $98,778 |
| Uruguayans | 30.3 /100 | #194 | Fair $98,660 |
| Spanish | 29.2 /100 | #195 | Fair $98,554 |
| Immigrants | Eastern Africa | 28.3 /100 | #196 | Fair $98,467 |
| Puget Sound Salish | 27.0 /100 | #197 | Fair $98,340 |
| Immigrants | Iraq | 25.7 /100 | #198 | Fair $98,201 |
| Whites/Caucasians | 24.6 /100 | #199 | Fair $98,091 |
| Immigrants | Kenya | 23.5 /100 | #200 | Fair $97,964 |
| Yugoslavians | 20.0 /100 | #201 | Fair $97,558 |
| Tlingit-Haida | 18.9 /100 | #202 | Poor $97,417 |
| Immigrants | Thailand | 18.8 /100 | #203 | Poor $97,400 |
Demographics Similar to Immigrants from Dominica by Householder Income Ages 45 - 64 years
In terms of householder income ages 45 - 64 years, the demographic groups most similar to Immigrants from Dominica are Immigrants from Haiti ($83,257, a difference of 0.060%), Immigrants from Bahamas ($83,177, a difference of 0.16%), Immigrants from Cabo Verde ($83,542, a difference of 0.28%), Shoshone ($83,588, a difference of 0.33%), and Cajun ($83,015, a difference of 0.36%).
| Demographics | Rating | Rank | Householder Income Ages 45 - 64 years |
| Haitians | 0.0 /100 | #302 | Tragic $84,384 |
| Hondurans | 0.0 /100 | #303 | Tragic $84,079 |
| Ottawa | 0.0 /100 | #304 | Tragic $83,953 |
| Chippewa | 0.0 /100 | #305 | Tragic $83,943 |
| Ute | 0.0 /100 | #306 | Tragic $83,937 |
| Shoshone | 0.0 /100 | #307 | Tragic $83,588 |
| Immigrants | Cabo Verde | 0.0 /100 | #308 | Tragic $83,542 |
| Immigrants | Dominica | 0.0 /100 | #309 | Tragic $83,311 |
| Immigrants | Haiti | 0.0 /100 | #310 | Tragic $83,257 |
| Immigrants | Bahamas | 0.0 /100 | #311 | Tragic $83,177 |
| Cajuns | 0.0 /100 | #312 | Tragic $83,015 |
| U.S. Virgin Islanders | 0.0 /100 | #313 | Tragic $82,736 |
| Immigrants | Honduras | 0.0 /100 | #314 | Tragic $82,697 |
| Paiute | 0.0 /100 | #315 | Tragic $82,629 |
| Immigrants | Caribbean | 0.0 /100 | #316 | Tragic $82,513 |