Burmese vs Immigrants from Russia In Labor Force | Age 20-24
COMPARE
Burmese
Immigrants from Russia
In Labor Force | Age 20-24
In Labor Force | Age 20-24 Comparison
Burmese
Immigrants from Russia
73.6%
IN LABOR FORCE | AGE 20-24
0.5/ 100
METRIC RATING
265th/ 347
METRIC RANK
73.5%
IN LABOR FORCE | AGE 20-24
0.3/ 100
METRIC RATING
270th/ 347
METRIC RANK
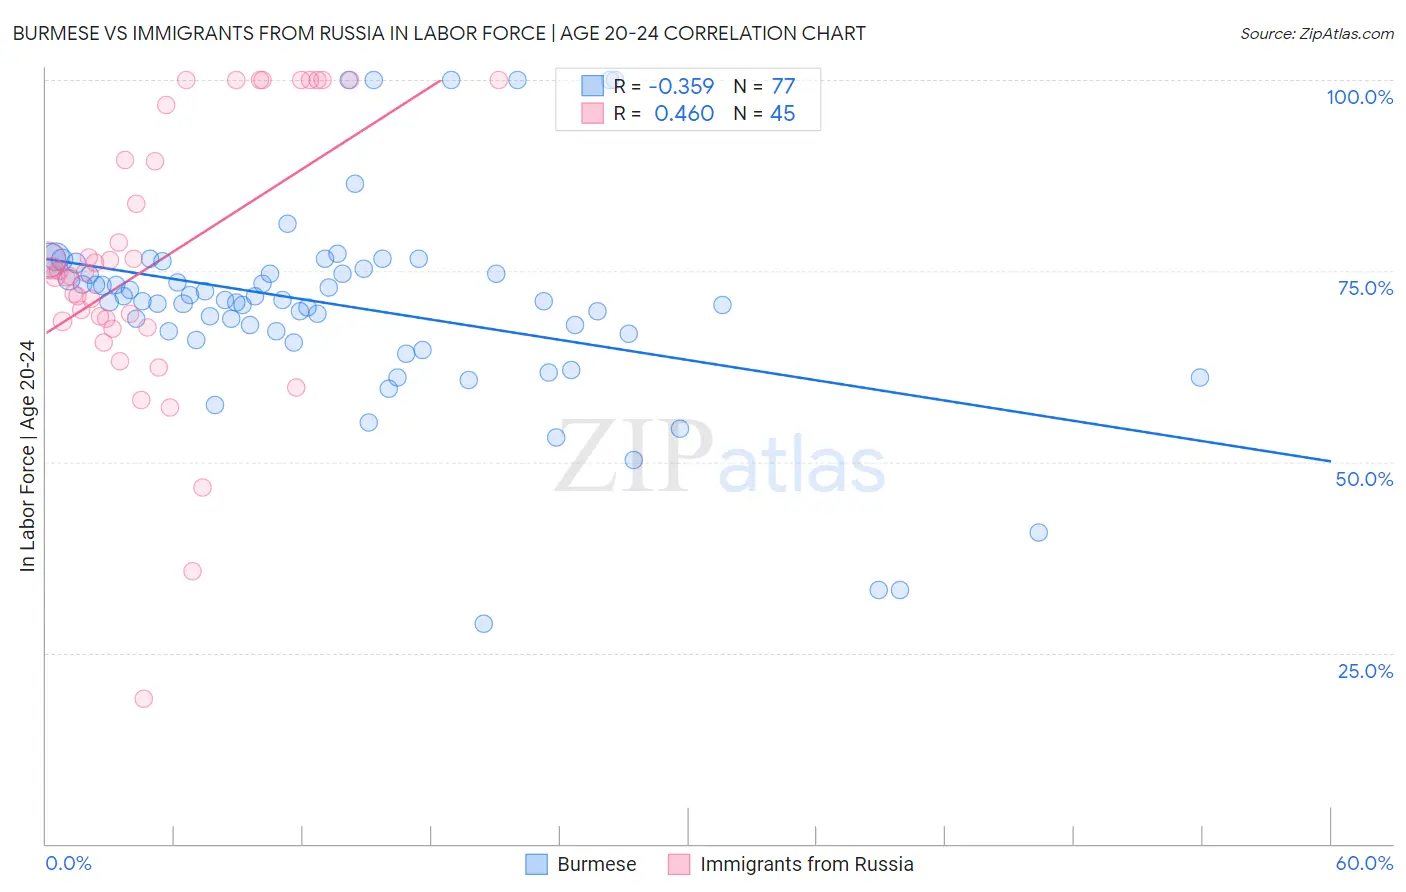
Burmese vs Immigrants from Russia In Labor Force | Age 20-24 Correlation Chart
The statistical analysis conducted on geographies consisting of 465,182,635 people shows a mild negative correlation between the proportion of Burmese and labor force participation rate among population between the ages 20 and 24 in the United States with a correlation coefficient (R) of -0.359 and weighted average of 73.6%. Similarly, the statistical analysis conducted on geographies consisting of 347,833,174 people shows a moderate positive correlation between the proportion of Immigrants from Russia and labor force participation rate among population between the ages 20 and 24 in the United States with a correlation coefficient (R) of 0.460 and weighted average of 73.5%, a difference of 0.15%.
In Labor Force | Age 20-24 Correlation Summary
| Measurement | Burmese | Immigrants from Russia |
| Minimum | 28.8% | 19.0% |
| Maximum | 100.0% | 100.0% |
| Range | 71.2% | 81.0% |
| Mean | 70.4% | 76.3% |
| Median | 71.0% | 74.8% |
| Interquartile 25% (IQ1) | 66.3% | 68.0% |
| Interquartile 75% (IQ3) | 75.0% | 93.2% |
| Interquartile Range (IQR) | 8.7% | 25.2% |
| Standard Deviation (Sample) | 13.4% | 18.0% |
| Standard Deviation (Population) | 13.3% | 17.8% |
Demographics Similar to Burmese and Immigrants from Russia by In Labor Force | Age 20-24
In terms of in labor force | age 20-24, the demographic groups most similar to Burmese are Haitian (73.6%, a difference of 0.0%), Immigrants from Haiti (73.6%, a difference of 0.010%), Immigrants from Asia (73.6%, a difference of 0.020%), Immigrants from Western Asia (73.5%, a difference of 0.040%), and South American (73.5%, a difference of 0.090%). Similarly, the demographic groups most similar to Immigrants from Russia are Colombian (73.5%, a difference of 0.030%), Immigrants from Indonesia (73.4%, a difference of 0.050%), South American (73.5%, a difference of 0.060%), Belizean (73.4%, a difference of 0.060%), and Cheyenne (73.4%, a difference of 0.090%).
| Demographics | Rating | Rank | In Labor Force | Age 20-24 |
| Paraguayans | 0.8 /100 | #257 | Tragic 73.7% |
| Egyptians | 0.7 /100 | #258 | Tragic 73.7% |
| Dutch West Indians | 0.7 /100 | #259 | Tragic 73.7% |
| Immigrants | Turkey | 0.7 /100 | #260 | Tragic 73.7% |
| Houma | 0.6 /100 | #261 | Tragic 73.7% |
| Asians | 0.6 /100 | #262 | Tragic 73.7% |
| Immigrants | Asia | 0.5 /100 | #263 | Tragic 73.6% |
| Immigrants | Haiti | 0.5 /100 | #264 | Tragic 73.6% |
| Burmese | 0.5 /100 | #265 | Tragic 73.6% |
| Haitians | 0.5 /100 | #266 | Tragic 73.6% |
| Immigrants | Western Asia | 0.4 /100 | #267 | Tragic 73.5% |
| South Americans | 0.4 /100 | #268 | Tragic 73.5% |
| Colombians | 0.3 /100 | #269 | Tragic 73.5% |
| Immigrants | Russia | 0.3 /100 | #270 | Tragic 73.5% |
| Immigrants | Indonesia | 0.3 /100 | #271 | Tragic 73.4% |
| Belizeans | 0.3 /100 | #272 | Tragic 73.4% |
| Cheyenne | 0.2 /100 | #273 | Tragic 73.4% |
| Immigrants | Colombia | 0.2 /100 | #274 | Tragic 73.4% |
| Immigrants | South America | 0.2 /100 | #275 | Tragic 73.3% |
| Mongolians | 0.2 /100 | #276 | Tragic 73.3% |
| Immigrants | Malaysia | 0.2 /100 | #277 | Tragic 73.3% |