Irish vs Immigrants from Russia In Labor Force | Age 20-24
COMPARE
Irish
Immigrants from Russia
In Labor Force | Age 20-24
In Labor Force | Age 20-24 Comparison
Irish
Immigrants from Russia
77.4%
IN LABOR FORCE | AGE 20-24
100.0/ 100
METRIC RATING
39th/ 347
METRIC RANK
73.5%
IN LABOR FORCE | AGE 20-24
0.3/ 100
METRIC RATING
270th/ 347
METRIC RANK
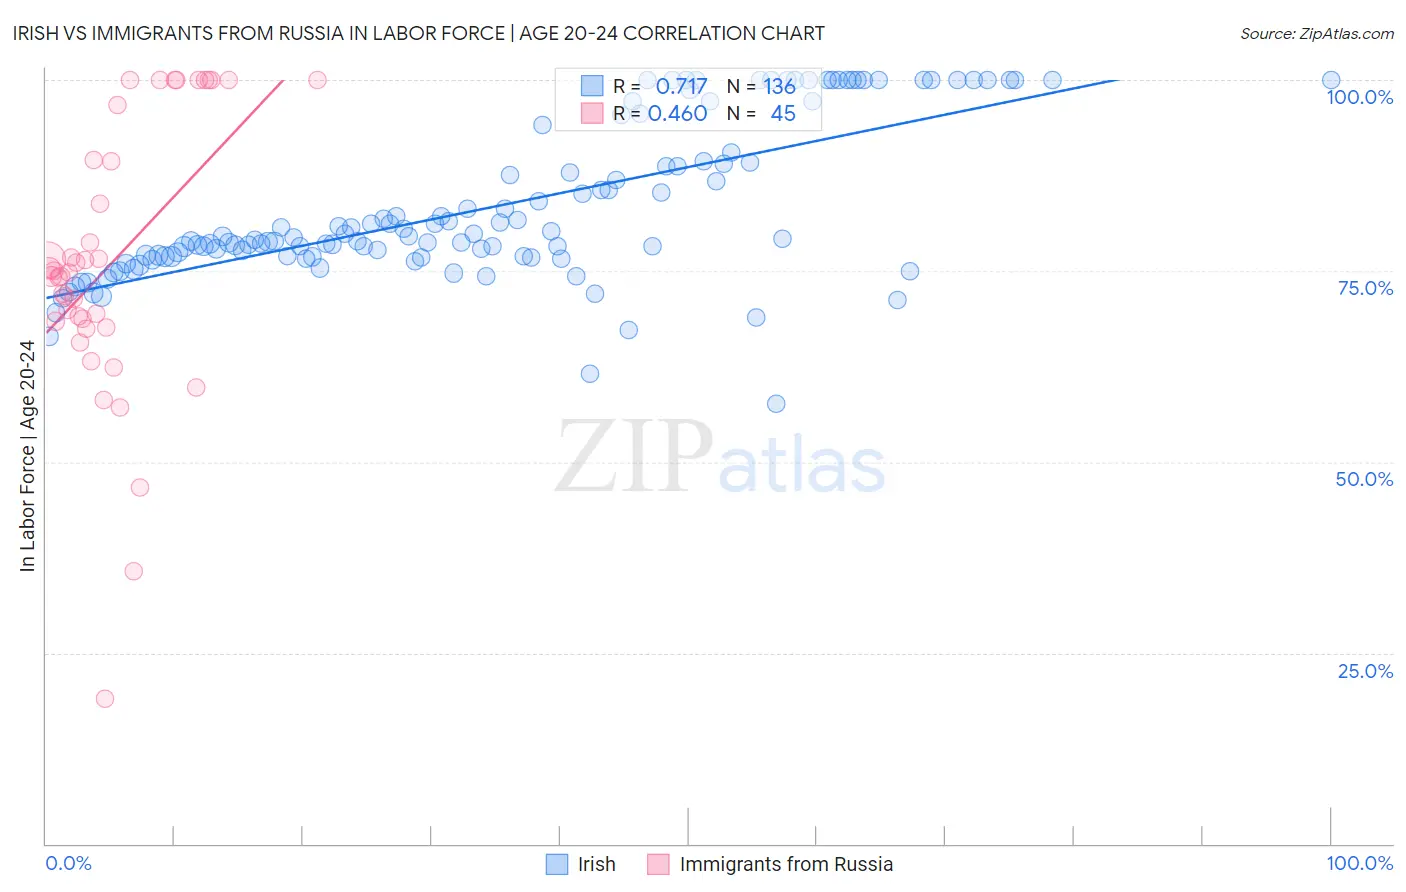
Irish vs Immigrants from Russia In Labor Force | Age 20-24 Correlation Chart
The statistical analysis conducted on geographies consisting of 578,188,051 people shows a strong positive correlation between the proportion of Irish and labor force participation rate among population between the ages 20 and 24 in the United States with a correlation coefficient (R) of 0.717 and weighted average of 77.4%. Similarly, the statistical analysis conducted on geographies consisting of 347,833,174 people shows a moderate positive correlation between the proportion of Immigrants from Russia and labor force participation rate among population between the ages 20 and 24 in the United States with a correlation coefficient (R) of 0.460 and weighted average of 73.5%, a difference of 5.4%.
In Labor Force | Age 20-24 Correlation Summary
| Measurement | Irish | Immigrants from Russia |
| Minimum | 57.7% | 19.0% |
| Maximum | 100.0% | 100.0% |
| Range | 42.3% | 81.0% |
| Mean | 83.4% | 76.3% |
| Median | 79.5% | 74.8% |
| Interquartile 25% (IQ1) | 76.9% | 68.0% |
| Interquartile 75% (IQ3) | 89.9% | 93.2% |
| Interquartile Range (IQR) | 13.1% | 25.2% |
| Standard Deviation (Sample) | 10.2% | 18.0% |
| Standard Deviation (Population) | 10.2% | 17.8% |
Similar Demographics by In Labor Force | Age 20-24
Demographics Similar to Irish by In Labor Force | Age 20-24
In terms of in labor force | age 20-24, the demographic groups most similar to Irish are Marshallese (77.4%, a difference of 0.030%), Scottish (77.4%, a difference of 0.030%), Immigrants from Congo (77.4%, a difference of 0.040%), French (77.4%, a difference of 0.050%), and Immigrants from Laos (77.4%, a difference of 0.060%).
| Demographics | Rating | Rank | In Labor Force | Age 20-24 |
| English | 100.0 /100 | #32 | Exceptional 77.6% |
| Immigrants | Ethiopia | 100.0 /100 | #33 | Exceptional 77.5% |
| German Russians | 100.0 /100 | #34 | Exceptional 77.5% |
| Immigrants | Eastern Africa | 100.0 /100 | #35 | Exceptional 77.5% |
| Welsh | 100.0 /100 | #36 | Exceptional 77.5% |
| Czechoslovakians | 100.0 /100 | #37 | Exceptional 77.5% |
| Marshallese | 100.0 /100 | #38 | Exceptional 77.4% |
| Irish | 100.0 /100 | #39 | Exceptional 77.4% |
| Scottish | 100.0 /100 | #40 | Exceptional 77.4% |
| Immigrants | Congo | 100.0 /100 | #41 | Exceptional 77.4% |
| French | 100.0 /100 | #42 | Exceptional 77.4% |
| Immigrants | Laos | 100.0 /100 | #43 | Exceptional 77.4% |
| Fijians | 100.0 /100 | #44 | Exceptional 77.4% |
| Native Hawaiians | 100.0 /100 | #45 | Exceptional 77.4% |
| Samoans | 100.0 /100 | #46 | Exceptional 77.4% |
Demographics Similar to Immigrants from Russia by In Labor Force | Age 20-24
In terms of in labor force | age 20-24, the demographic groups most similar to Immigrants from Russia are Colombian (73.5%, a difference of 0.030%), Immigrants from Indonesia (73.4%, a difference of 0.050%), South American (73.5%, a difference of 0.060%), Belizean (73.4%, a difference of 0.060%), and Cheyenne (73.4%, a difference of 0.090%).
| Demographics | Rating | Rank | In Labor Force | Age 20-24 |
| Immigrants | Asia | 0.5 /100 | #263 | Tragic 73.6% |
| Immigrants | Haiti | 0.5 /100 | #264 | Tragic 73.6% |
| Burmese | 0.5 /100 | #265 | Tragic 73.6% |
| Haitians | 0.5 /100 | #266 | Tragic 73.6% |
| Immigrants | Western Asia | 0.4 /100 | #267 | Tragic 73.5% |
| South Americans | 0.4 /100 | #268 | Tragic 73.5% |
| Colombians | 0.3 /100 | #269 | Tragic 73.5% |
| Immigrants | Russia | 0.3 /100 | #270 | Tragic 73.5% |
| Immigrants | Indonesia | 0.3 /100 | #271 | Tragic 73.4% |
| Belizeans | 0.3 /100 | #272 | Tragic 73.4% |
| Cheyenne | 0.2 /100 | #273 | Tragic 73.4% |
| Immigrants | Colombia | 0.2 /100 | #274 | Tragic 73.4% |
| Immigrants | South America | 0.2 /100 | #275 | Tragic 73.3% |
| Mongolians | 0.2 /100 | #276 | Tragic 73.3% |
| Immigrants | Malaysia | 0.2 /100 | #277 | Tragic 73.3% |