Nicaraguan vs German In Labor Force | Age 20-24
COMPARE
Nicaraguan
German
In Labor Force | Age 20-24
In Labor Force | Age 20-24 Comparison
Nicaraguans
Germans
73.2%
IN LABOR FORCE | AGE 20-24
0.1/ 100
METRIC RATING
285th/ 347
METRIC RANK
78.6%
IN LABOR FORCE | AGE 20-24
100.0/ 100
METRIC RATING
12th/ 347
METRIC RANK
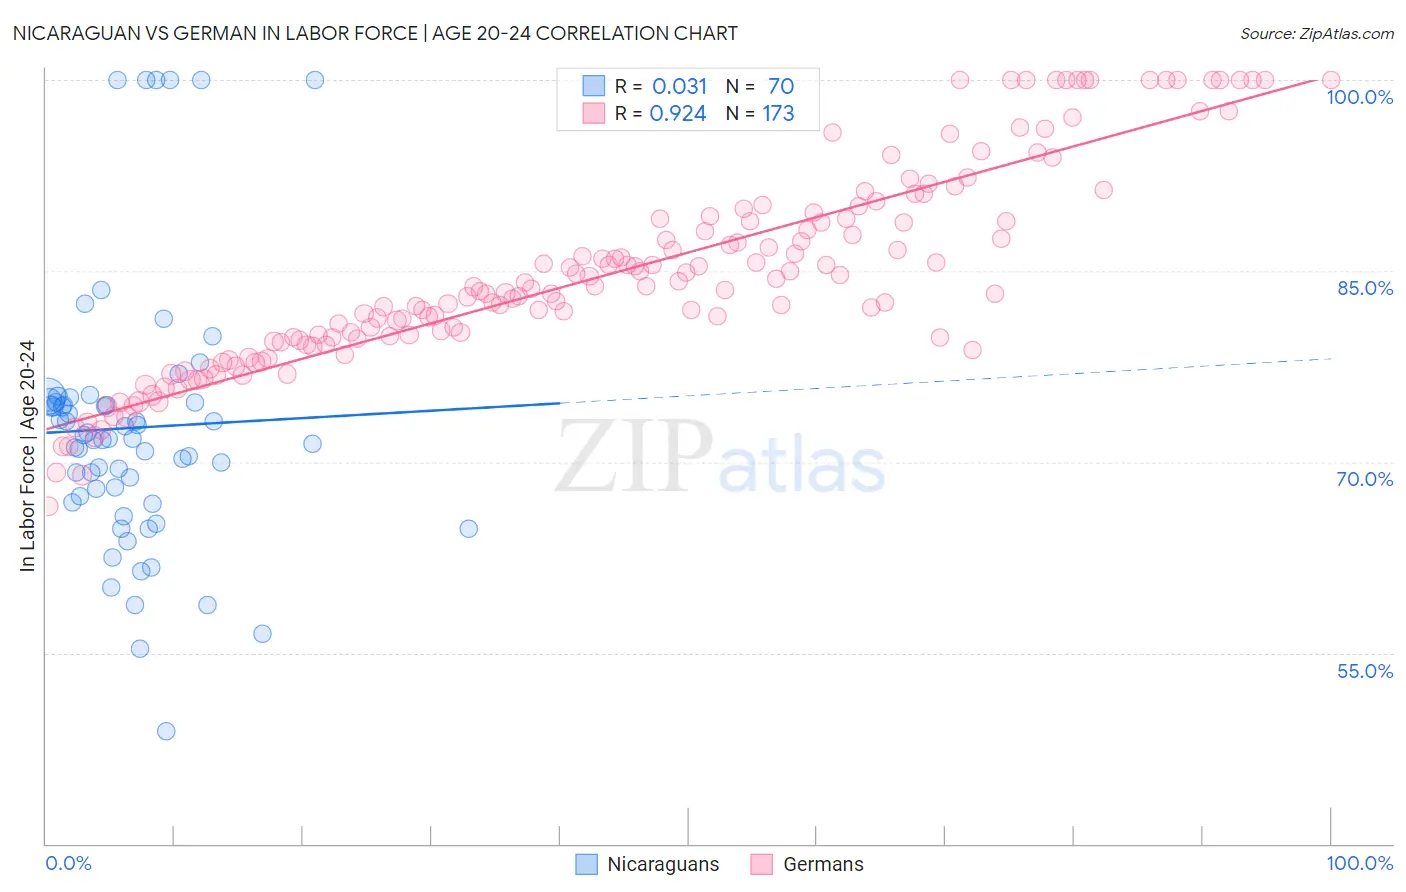
Nicaraguan vs German In Labor Force | Age 20-24 Correlation Chart
The statistical analysis conducted on geographies consisting of 285,678,099 people shows no correlation between the proportion of Nicaraguans and labor force participation rate among population between the ages 20 and 24 in the United States with a correlation coefficient (R) of 0.031 and weighted average of 73.2%. Similarly, the statistical analysis conducted on geographies consisting of 578,744,060 people shows a near-perfect positive correlation between the proportion of Germans and labor force participation rate among population between the ages 20 and 24 in the United States with a correlation coefficient (R) of 0.924 and weighted average of 78.6%, a difference of 7.4%.
In Labor Force | Age 20-24 Correlation Summary
| Measurement | Nicaraguan | German |
| Minimum | 48.8% | 66.5% |
| Maximum | 100.0% | 100.0% |
| Range | 51.2% | 33.5% |
| Mean | 72.7% | 84.7% |
| Median | 71.8% | 83.6% |
| Interquartile 25% (IQ1) | 67.3% | 79.5% |
| Interquartile 75% (IQ3) | 74.7% | 89.1% |
| Interquartile Range (IQR) | 7.4% | 9.6% |
| Standard Deviation (Sample) | 10.5% | 7.8% |
| Standard Deviation (Population) | 10.4% | 7.8% |
Similar Demographics by In Labor Force | Age 20-24
Demographics Similar to Nicaraguans by In Labor Force | Age 20-24
In terms of in labor force | age 20-24, the demographic groups most similar to Nicaraguans are Immigrants from Lebanon (73.1%, a difference of 0.030%), Immigrants from Korea (73.1%, a difference of 0.050%), Kiowa (73.2%, a difference of 0.060%), Immigrants from Bahamas (73.2%, a difference of 0.080%), and Immigrants from Venezuela (73.2%, a difference of 0.090%).
| Demographics | Rating | Rank | In Labor Force | Age 20-24 |
| Cypriots | 0.2 /100 | #278 | Tragic 73.3% |
| Venezuelans | 0.2 /100 | #279 | Tragic 73.3% |
| Bahamians | 0.1 /100 | #280 | Tragic 73.3% |
| Immigrants | Venezuela | 0.1 /100 | #281 | Tragic 73.2% |
| Immigrants | Spain | 0.1 /100 | #282 | Tragic 73.2% |
| Immigrants | Bahamas | 0.1 /100 | #283 | Tragic 73.2% |
| Kiowa | 0.1 /100 | #284 | Tragic 73.2% |
| Nicaraguans | 0.1 /100 | #285 | Tragic 73.2% |
| Immigrants | Lebanon | 0.1 /100 | #286 | Tragic 73.1% |
| Immigrants | Korea | 0.1 /100 | #287 | Tragic 73.1% |
| Argentineans | 0.1 /100 | #288 | Tragic 73.1% |
| U.S. Virgin Islanders | 0.1 /100 | #289 | Tragic 73.0% |
| Immigrants | Belarus | 0.1 /100 | #290 | Tragic 73.0% |
| Immigrants | Nicaragua | 0.0 /100 | #291 | Tragic 72.9% |
| Pueblo | 0.0 /100 | #292 | Tragic 72.9% |
Demographics Similar to Germans by In Labor Force | Age 20-24
In terms of in labor force | age 20-24, the demographic groups most similar to Germans are Scandinavian (78.5%, a difference of 0.070%), Czech (78.5%, a difference of 0.070%), Finnish (78.7%, a difference of 0.11%), Slovene (78.7%, a difference of 0.15%), and Sudanese (78.4%, a difference of 0.21%).
| Demographics | Rating | Rank | In Labor Force | Age 20-24 |
| Aleuts | 100.0 /100 | #5 | Exceptional 79.0% |
| Danes | 100.0 /100 | #6 | Exceptional 79.0% |
| Luxembourgers | 100.0 /100 | #7 | Exceptional 79.0% |
| Immigrants | Cabo Verde | 100.0 /100 | #8 | Exceptional 78.9% |
| Swedes | 100.0 /100 | #9 | Exceptional 78.8% |
| Slovenes | 100.0 /100 | #10 | Exceptional 78.7% |
| Finns | 100.0 /100 | #11 | Exceptional 78.7% |
| Germans | 100.0 /100 | #12 | Exceptional 78.6% |
| Scandinavians | 100.0 /100 | #13 | Exceptional 78.5% |
| Czechs | 100.0 /100 | #14 | Exceptional 78.5% |
| Sudanese | 100.0 /100 | #15 | Exceptional 78.4% |
| Dutch | 100.0 /100 | #16 | Exceptional 78.4% |
| Cape Verdeans | 100.0 /100 | #17 | Exceptional 78.3% |
| Immigrants | Bosnia and Herzegovina | 100.0 /100 | #18 | Exceptional 78.1% |
| Bangladeshis | 100.0 /100 | #19 | Exceptional 78.1% |