Immigrants from Dominican Republic vs U.S. Virgin Islander In Labor Force | Age 35-44
COMPARE
Immigrants from Dominican Republic
U.S. Virgin Islander
In Labor Force | Age 35-44
In Labor Force | Age 35-44 Comparison
Immigrants from Dominican Republic
U.S. Virgin Islanders
82.9%
IN LABOR FORCE | AGE 35-44
0.0/ 100
METRIC RATING
284th/ 347
METRIC RANK
84.0%
IN LABOR FORCE | AGE 35-44
6.1/ 100
METRIC RATING
224th/ 347
METRIC RANK
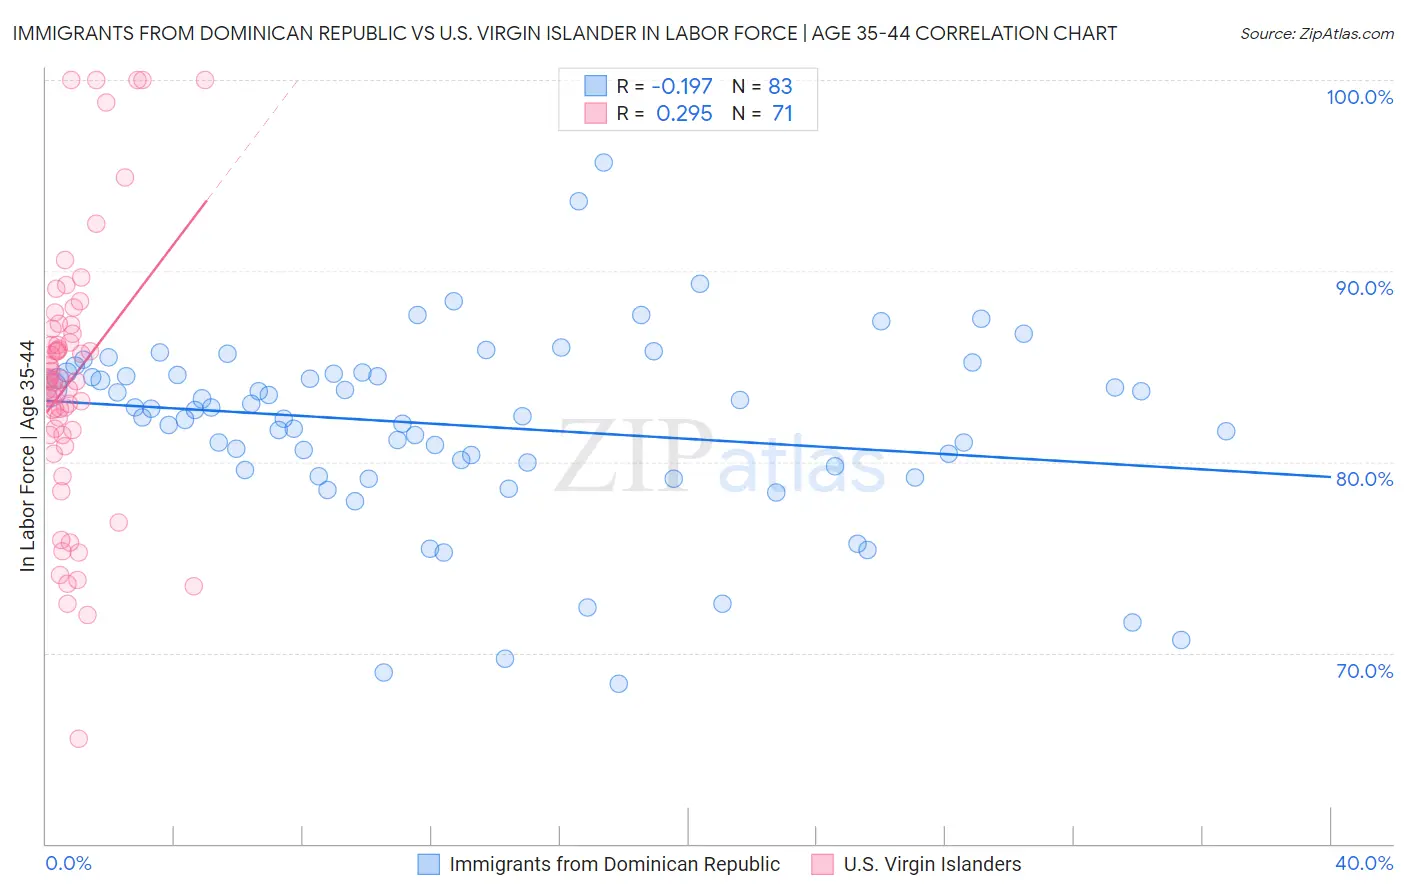
Immigrants from Dominican Republic vs U.S. Virgin Islander In Labor Force | Age 35-44 Correlation Chart
The statistical analysis conducted on geographies consisting of 275,005,604 people shows a poor negative correlation between the proportion of Immigrants from Dominican Republic and labor force participation rate among population between the ages 35 and 44 in the United States with a correlation coefficient (R) of -0.197 and weighted average of 82.9%. Similarly, the statistical analysis conducted on geographies consisting of 87,507,209 people shows a weak positive correlation between the proportion of U.S. Virgin Islanders and labor force participation rate among population between the ages 35 and 44 in the United States with a correlation coefficient (R) of 0.295 and weighted average of 84.0%, a difference of 1.3%.
In Labor Force | Age 35-44 Correlation Summary
| Measurement | Immigrants from Dominican Republic | U.S. Virgin Islander |
| Minimum | 68.4% | 65.5% |
| Maximum | 95.7% | 100.0% |
| Range | 27.3% | 34.5% |
| Mean | 81.9% | 84.3% |
| Median | 82.7% | 84.2% |
| Interquartile 25% (IQ1) | 79.8% | 81.4% |
| Interquartile 75% (IQ3) | 84.6% | 87.0% |
| Interquartile Range (IQR) | 4.9% | 5.6% |
| Standard Deviation (Sample) | 4.9% | 7.0% |
| Standard Deviation (Population) | 4.9% | 6.9% |
Similar Demographics by In Labor Force | Age 35-44
Demographics Similar to Immigrants from Dominican Republic by In Labor Force | Age 35-44
In terms of in labor force | age 35-44, the demographic groups most similar to Immigrants from Dominican Republic are Osage (82.9%, a difference of 0.010%), Immigrants from Guatemala (82.9%, a difference of 0.010%), Fijian (82.9%, a difference of 0.010%), Immigrants from Bangladesh (82.9%, a difference of 0.010%), and Immigrants from Belize (82.9%, a difference of 0.020%).
| Demographics | Rating | Rank | In Labor Force | Age 35-44 |
| Samoans | 0.0 /100 | #277 | Tragic 83.2% |
| Belizeans | 0.0 /100 | #278 | Tragic 83.1% |
| Immigrants | Micronesia | 0.0 /100 | #279 | Tragic 83.1% |
| Dominicans | 0.0 /100 | #280 | Tragic 83.1% |
| Guatemalans | 0.0 /100 | #281 | Tragic 83.0% |
| Osage | 0.0 /100 | #282 | Tragic 82.9% |
| Immigrants | Guatemala | 0.0 /100 | #283 | Tragic 82.9% |
| Immigrants | Dominican Republic | 0.0 /100 | #284 | Tragic 82.9% |
| Fijians | 0.0 /100 | #285 | Tragic 82.9% |
| Immigrants | Bangladesh | 0.0 /100 | #286 | Tragic 82.9% |
| Immigrants | Belize | 0.0 /100 | #287 | Tragic 82.9% |
| Puget Sound Salish | 0.0 /100 | #288 | Tragic 82.9% |
| Chippewa | 0.0 /100 | #289 | Tragic 82.9% |
| Africans | 0.0 /100 | #290 | Tragic 82.9% |
| Pennsylvania Germans | 0.0 /100 | #291 | Tragic 82.9% |
Demographics Similar to U.S. Virgin Islanders by In Labor Force | Age 35-44
In terms of in labor force | age 35-44, the demographic groups most similar to U.S. Virgin Islanders are Immigrants from Burma/Myanmar (84.0%, a difference of 0.0%), Assyrian/Chaldean/Syriac (84.0%, a difference of 0.010%), Immigrants from Panama (84.0%, a difference of 0.010%), Icelander (84.0%, a difference of 0.020%), and Panamanian (84.0%, a difference of 0.020%).
| Demographics | Rating | Rank | In Labor Force | Age 35-44 |
| Immigrants | Norway | 11.7 /100 | #217 | Poor 84.1% |
| Immigrants | Nicaragua | 9.4 /100 | #218 | Tragic 84.1% |
| Sub-Saharan Africans | 9.3 /100 | #219 | Tragic 84.1% |
| French | 7.5 /100 | #220 | Tragic 84.0% |
| Icelanders | 6.7 /100 | #221 | Tragic 84.0% |
| Assyrians/Chaldeans/Syriacs | 6.6 /100 | #222 | Tragic 84.0% |
| Immigrants | Panama | 6.4 /100 | #223 | Tragic 84.0% |
| U.S. Virgin Islanders | 6.1 /100 | #224 | Tragic 84.0% |
| Immigrants | Burma/Myanmar | 6.1 /100 | #225 | Tragic 84.0% |
| Panamanians | 5.4 /100 | #226 | Tragic 84.0% |
| British West Indians | 5.3 /100 | #227 | Tragic 84.0% |
| Welsh | 5.3 /100 | #228 | Tragic 84.0% |
| Immigrants | Thailand | 4.7 /100 | #229 | Tragic 84.0% |
| Immigrants | Iraq | 3.7 /100 | #230 | Tragic 83.9% |
| Scottish | 3.2 /100 | #231 | Tragic 83.9% |