Immigrants from Dominican Republic vs Honduran In Labor Force | Age 35-44
COMPARE
Immigrants from Dominican Republic
Honduran
In Labor Force | Age 35-44
In Labor Force | Age 35-44 Comparison
Immigrants from Dominican Republic
Hondurans
82.9%
IN LABOR FORCE | AGE 35-44
0.0/ 100
METRIC RATING
284th/ 347
METRIC RANK
83.4%
IN LABOR FORCE | AGE 35-44
0.1/ 100
METRIC RATING
268th/ 347
METRIC RANK
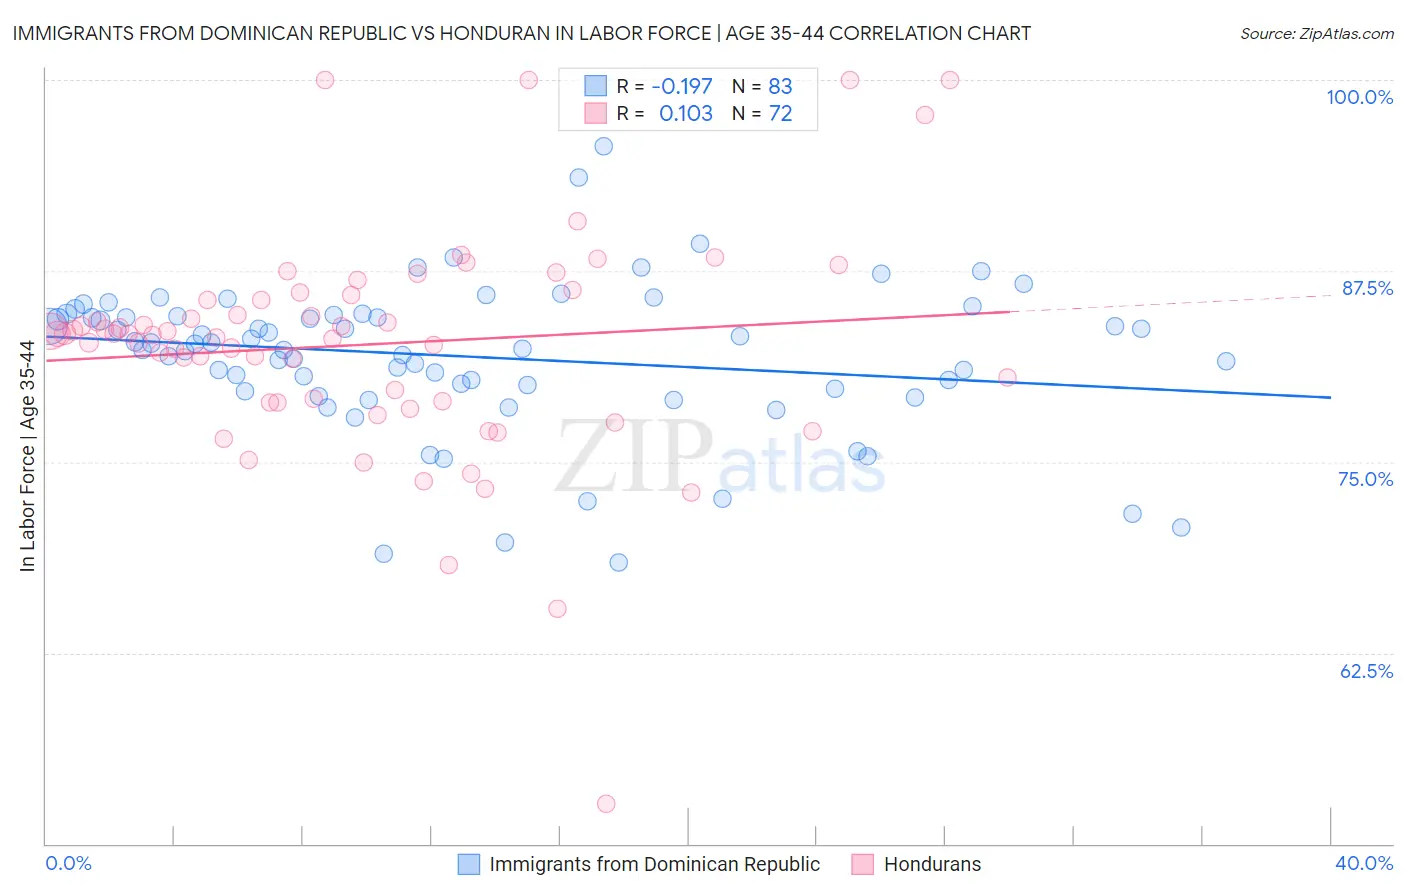
Immigrants from Dominican Republic vs Honduran In Labor Force | Age 35-44 Correlation Chart
The statistical analysis conducted on geographies consisting of 275,005,604 people shows a poor negative correlation between the proportion of Immigrants from Dominican Republic and labor force participation rate among population between the ages 35 and 44 in the United States with a correlation coefficient (R) of -0.197 and weighted average of 82.9%. Similarly, the statistical analysis conducted on geographies consisting of 357,674,403 people shows a poor positive correlation between the proportion of Hondurans and labor force participation rate among population between the ages 35 and 44 in the United States with a correlation coefficient (R) of 0.103 and weighted average of 83.4%, a difference of 0.50%.
In Labor Force | Age 35-44 Correlation Summary
| Measurement | Immigrants from Dominican Republic | Honduran |
| Minimum | 68.4% | 52.6% |
| Maximum | 95.7% | 100.0% |
| Range | 27.3% | 47.4% |
| Mean | 81.9% | 82.7% |
| Median | 82.7% | 83.4% |
| Interquartile 25% (IQ1) | 79.8% | 79.0% |
| Interquartile 75% (IQ3) | 84.6% | 85.8% |
| Interquartile Range (IQR) | 4.9% | 6.8% |
| Standard Deviation (Sample) | 4.9% | 7.5% |
| Standard Deviation (Population) | 4.9% | 7.4% |
Demographics Similar to Immigrants from Dominican Republic and Hondurans by In Labor Force | Age 35-44
In terms of in labor force | age 35-44, the demographic groups most similar to Immigrants from Dominican Republic are Osage (82.9%, a difference of 0.010%), Immigrants from Guatemala (82.9%, a difference of 0.010%), Fijian (82.9%, a difference of 0.010%), Immigrants from Bangladesh (82.9%, a difference of 0.010%), and Guatemalan (83.0%, a difference of 0.050%). Similarly, the demographic groups most similar to Hondurans are Immigrants from Grenada (83.3%, a difference of 0.010%), Guamanian/Chamorro (83.4%, a difference of 0.030%), Spaniard (83.4%, a difference of 0.080%), Immigrants from Honduras (83.3%, a difference of 0.13%), and French American Indian (83.2%, a difference of 0.13%).
| Demographics | Rating | Rank | In Labor Force | Age 35-44 |
| Spaniards | 0.1 /100 | #266 | Tragic 83.4% |
| Guamanians/Chamorros | 0.1 /100 | #267 | Tragic 83.4% |
| Hondurans | 0.1 /100 | #268 | Tragic 83.4% |
| Immigrants | Grenada | 0.1 /100 | #269 | Tragic 83.3% |
| Immigrants | Honduras | 0.0 /100 | #270 | Tragic 83.3% |
| French American Indians | 0.0 /100 | #271 | Tragic 83.2% |
| Immigrants | Fiji | 0.0 /100 | #272 | Tragic 83.2% |
| Spanish | 0.0 /100 | #273 | Tragic 83.2% |
| Immigrants | Nonimmigrants | 0.0 /100 | #274 | Tragic 83.2% |
| Hawaiians | 0.0 /100 | #275 | Tragic 83.2% |
| Delaware | 0.0 /100 | #276 | Tragic 83.2% |
| Samoans | 0.0 /100 | #277 | Tragic 83.2% |
| Belizeans | 0.0 /100 | #278 | Tragic 83.1% |
| Immigrants | Micronesia | 0.0 /100 | #279 | Tragic 83.1% |
| Dominicans | 0.0 /100 | #280 | Tragic 83.1% |
| Guatemalans | 0.0 /100 | #281 | Tragic 83.0% |
| Osage | 0.0 /100 | #282 | Tragic 82.9% |
| Immigrants | Guatemala | 0.0 /100 | #283 | Tragic 82.9% |
| Immigrants | Dominican Republic | 0.0 /100 | #284 | Tragic 82.9% |
| Fijians | 0.0 /100 | #285 | Tragic 82.9% |
| Immigrants | Bangladesh | 0.0 /100 | #286 | Tragic 82.9% |