Immigrants from Dominica vs Immigrants from Western Asia In Labor Force | Age 30-34
COMPARE
Immigrants from Dominica
Immigrants from Western Asia
In Labor Force | Age 30-34
In Labor Force | Age 30-34 Comparison
Immigrants from Dominica
Immigrants from Western Asia
84.0%
IN LABOR FORCE | AGE 30-34
0.7/ 100
METRIC RATING
249th/ 347
METRIC RANK
84.3%
IN LABOR FORCE | AGE 30-34
8.2/ 100
METRIC RATING
212th/ 347
METRIC RANK
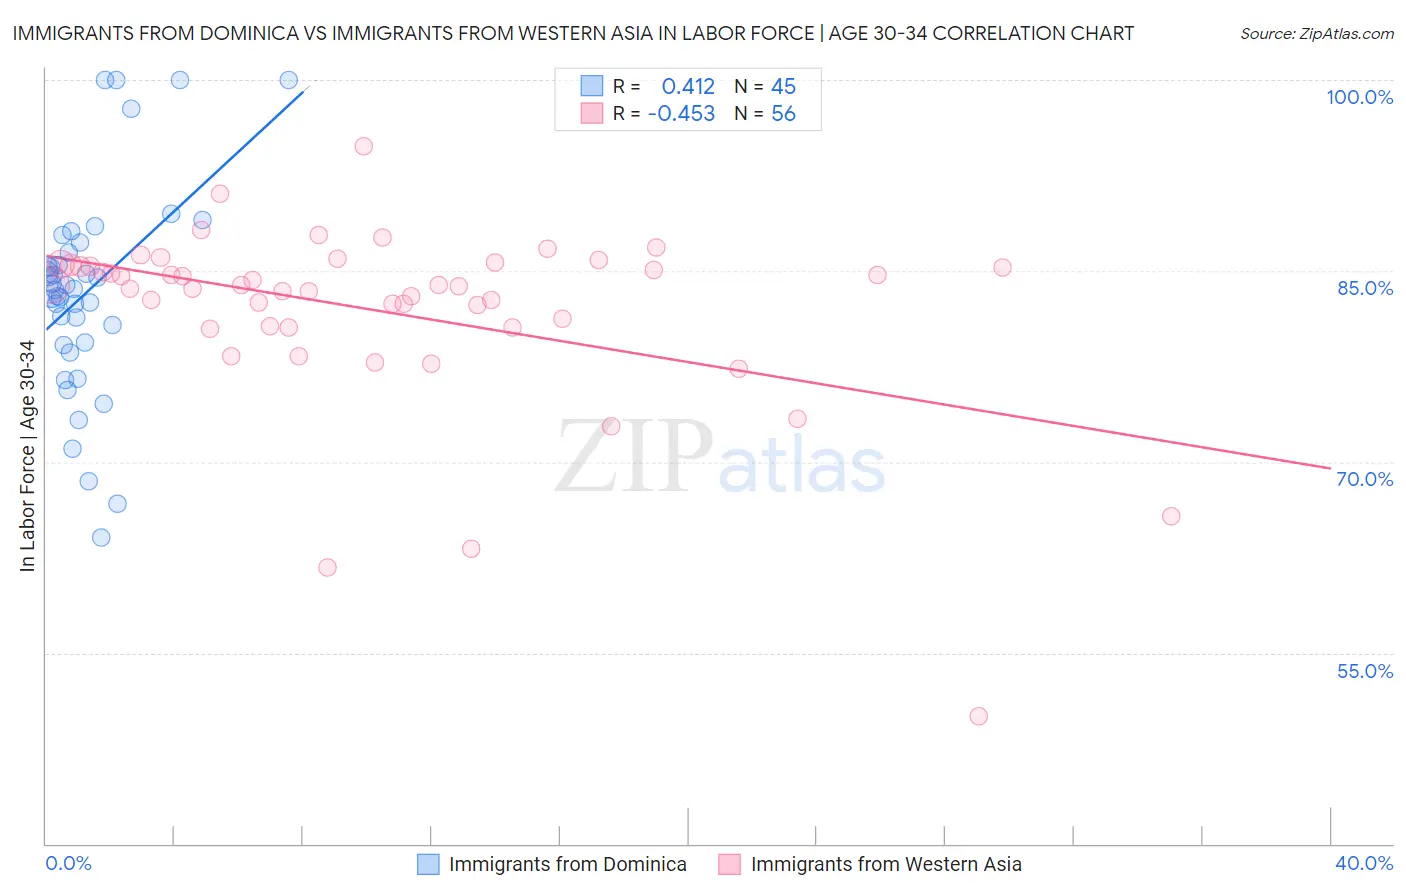
Immigrants from Dominica vs Immigrants from Western Asia In Labor Force | Age 30-34 Correlation Chart
The statistical analysis conducted on geographies consisting of 83,795,636 people shows a moderate positive correlation between the proportion of Immigrants from Dominica and labor force participation rate among population between the ages 30 and 34 in the United States with a correlation coefficient (R) of 0.412 and weighted average of 84.0%. Similarly, the statistical analysis conducted on geographies consisting of 404,180,460 people shows a moderate negative correlation between the proportion of Immigrants from Western Asia and labor force participation rate among population between the ages 30 and 34 in the United States with a correlation coefficient (R) of -0.453 and weighted average of 84.3%, a difference of 0.44%.
In Labor Force | Age 30-34 Correlation Summary
| Measurement | Immigrants from Dominica | Immigrants from Western Asia |
| Minimum | 64.1% | 50.0% |
| Maximum | 100.0% | 94.8% |
| Range | 35.9% | 44.8% |
| Mean | 83.4% | 81.9% |
| Median | 83.6% | 83.8% |
| Interquartile 25% (IQ1) | 79.3% | 80.6% |
| Interquartile 75% (IQ3) | 86.8% | 85.4% |
| Interquartile Range (IQR) | 7.5% | 4.8% |
| Standard Deviation (Sample) | 8.2% | 7.3% |
| Standard Deviation (Population) | 8.1% | 7.2% |
Similar Demographics by In Labor Force | Age 30-34
Demographics Similar to Immigrants from Dominica by In Labor Force | Age 30-34
In terms of in labor force | age 30-34, the demographic groups most similar to Immigrants from Dominica are Portuguese (84.0%, a difference of 0.0%), British West Indian (84.0%, a difference of 0.020%), Immigrants from Iraq (83.9%, a difference of 0.020%), Basque (84.0%, a difference of 0.040%), and Immigrants from Venezuela (84.0%, a difference of 0.040%).
| Demographics | Rating | Rank | In Labor Force | Age 30-34 |
| Immigrants | Oceania | 1.1 /100 | #242 | Tragic 84.0% |
| Immigrants | Caribbean | 1.1 /100 | #243 | Tragic 84.0% |
| Basques | 0.9 /100 | #244 | Tragic 84.0% |
| Immigrants | Venezuela | 0.9 /100 | #245 | Tragic 84.0% |
| Central Americans | 0.9 /100 | #246 | Tragic 84.0% |
| British West Indians | 0.8 /100 | #247 | Tragic 84.0% |
| Portuguese | 0.8 /100 | #248 | Tragic 84.0% |
| Immigrants | Dominica | 0.7 /100 | #249 | Tragic 84.0% |
| Immigrants | Iraq | 0.7 /100 | #250 | Tragic 83.9% |
| Nicaraguans | 0.6 /100 | #251 | Tragic 83.9% |
| Bahamians | 0.6 /100 | #252 | Tragic 83.9% |
| Immigrants | Nicaragua | 0.6 /100 | #253 | Tragic 83.9% |
| Immigrants | St. Vincent and the Grenadines | 0.5 /100 | #254 | Tragic 83.9% |
| Whites/Caucasians | 0.5 /100 | #255 | Tragic 83.9% |
| Immigrants | Lebanon | 0.4 /100 | #256 | Tragic 83.9% |
Demographics Similar to Immigrants from Western Asia by In Labor Force | Age 30-34
In terms of in labor force | age 30-34, the demographic groups most similar to Immigrants from Western Asia are Arab (84.3%, a difference of 0.010%), Jamaican (84.3%, a difference of 0.010%), Indonesian (84.3%, a difference of 0.010%), Japanese (84.3%, a difference of 0.010%), and Immigrants from Jamaica (84.3%, a difference of 0.010%).
| Demographics | Rating | Rank | In Labor Force | Age 30-34 |
| French | 13.8 /100 | #205 | Poor 84.4% |
| Lebanese | 10.6 /100 | #206 | Poor 84.4% |
| Bangladeshis | 9.4 /100 | #207 | Tragic 84.3% |
| Arabs | 8.9 /100 | #208 | Tragic 84.3% |
| Jamaicans | 8.8 /100 | #209 | Tragic 84.3% |
| Indonesians | 8.8 /100 | #210 | Tragic 84.3% |
| Japanese | 8.8 /100 | #211 | Tragic 84.3% |
| Immigrants | Western Asia | 8.2 /100 | #212 | Tragic 84.3% |
| Immigrants | Jamaica | 7.9 /100 | #213 | Tragic 84.3% |
| Immigrants | Germany | 7.2 /100 | #214 | Tragic 84.3% |
| Europeans | 7.2 /100 | #215 | Tragic 84.3% |
| Immigrants | Ecuador | 7.1 /100 | #216 | Tragic 84.3% |
| Immigrants | Trinidad and Tobago | 7.0 /100 | #217 | Tragic 84.3% |
| Immigrants | Panama | 6.3 /100 | #218 | Tragic 84.3% |
| Swiss | 5.8 /100 | #219 | Tragic 84.3% |