Immigrants from Somalia vs Native Hawaiian In Labor Force | Age 25-29
COMPARE
Immigrants from Somalia
Native Hawaiian
In Labor Force | Age 25-29
In Labor Force | Age 25-29 Comparison
Immigrants from Somalia
Native Hawaiians
87.1%
IN LABOR FORCE | AGE 25-29
100.0/ 100
METRIC RATING
2nd/ 347
METRIC RANK
82.9%
IN LABOR FORCE | AGE 25-29
0.0/ 100
METRIC RATING
298th/ 347
METRIC RANK
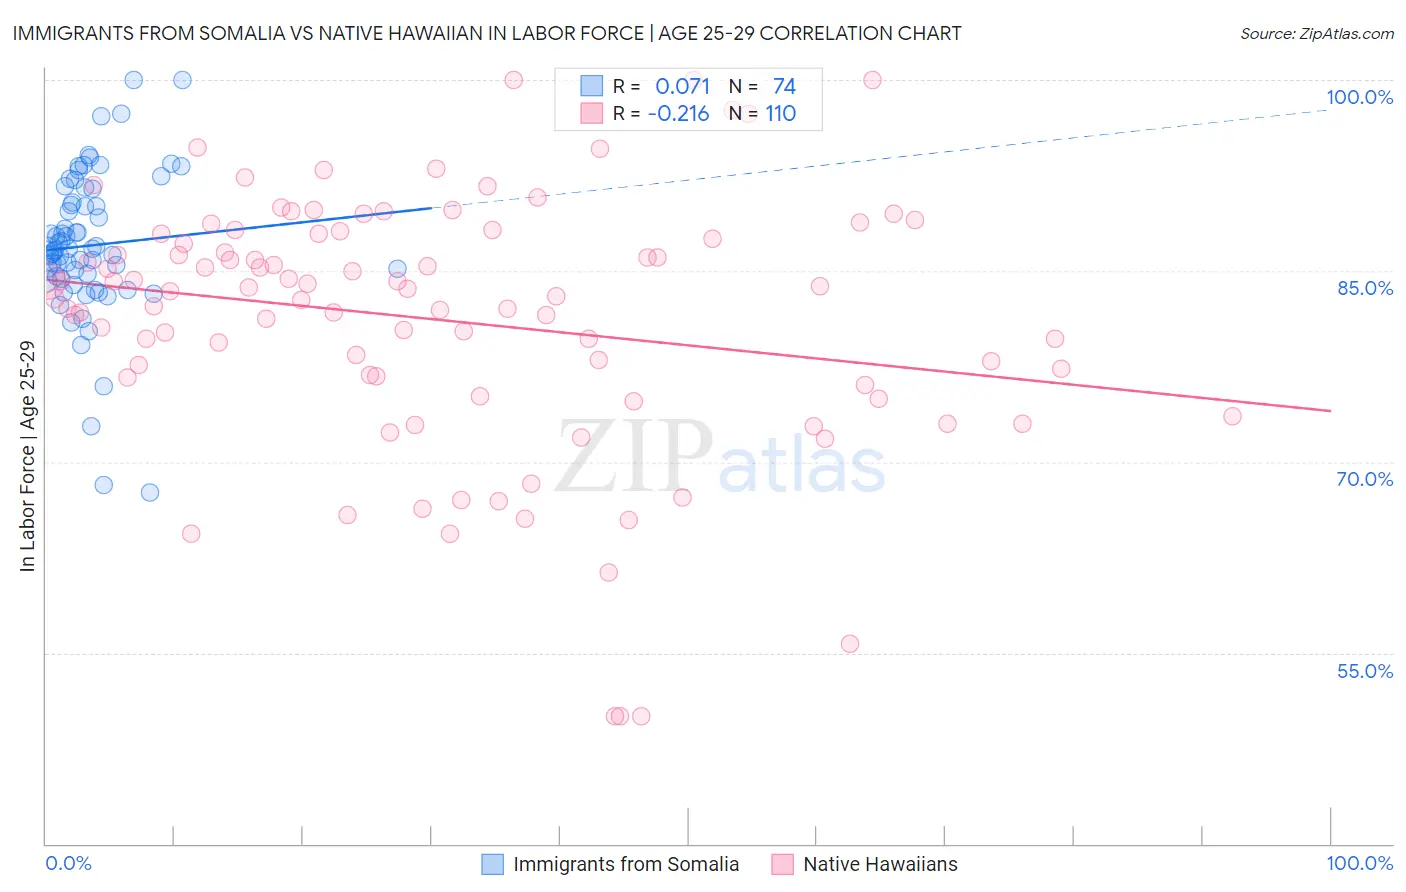
Immigrants from Somalia vs Native Hawaiian In Labor Force | Age 25-29 Correlation Chart
The statistical analysis conducted on geographies consisting of 92,105,545 people shows a slight positive correlation between the proportion of Immigrants from Somalia and labor force participation rate among population between the ages 25 and 29 in the United States with a correlation coefficient (R) of 0.071 and weighted average of 87.1%. Similarly, the statistical analysis conducted on geographies consisting of 332,007,245 people shows a weak negative correlation between the proportion of Native Hawaiians and labor force participation rate among population between the ages 25 and 29 in the United States with a correlation coefficient (R) of -0.216 and weighted average of 82.9%, a difference of 5.0%.
In Labor Force | Age 25-29 Correlation Summary
| Measurement | Immigrants from Somalia | Native Hawaiian |
| Minimum | 67.6% | 50.0% |
| Maximum | 100.0% | 100.0% |
| Range | 32.4% | 50.0% |
| Mean | 87.0% | 81.1% |
| Median | 86.7% | 83.2% |
| Interquartile 25% (IQ1) | 84.4% | 76.6% |
| Interquartile 75% (IQ3) | 90.4% | 87.9% |
| Interquartile Range (IQR) | 5.9% | 11.3% |
| Standard Deviation (Sample) | 5.8% | 10.1% |
| Standard Deviation (Population) | 5.8% | 10.1% |
Similar Demographics by In Labor Force | Age 25-29
Demographics Similar to Immigrants from Somalia by In Labor Force | Age 25-29
In terms of in labor force | age 25-29, the demographic groups most similar to Immigrants from Somalia are Somali (87.1%, a difference of 0.010%), Carpatho Rusyn (87.0%, a difference of 0.090%), Luxembourger (86.9%, a difference of 0.19%), Slovene (86.4%, a difference of 0.81%), and Immigrants from Bosnia and Herzegovina (86.3%, a difference of 0.93%).
| Demographics | Rating | Rank | In Labor Force | Age 25-29 |
| Tsimshian | 100.0 /100 | #1 | Exceptional 88.7% |
| Immigrants | Somalia | 100.0 /100 | #2 | Exceptional 87.1% |
| Somalis | 100.0 /100 | #3 | Exceptional 87.1% |
| Carpatho Rusyns | 100.0 /100 | #4 | Exceptional 87.0% |
| Luxembourgers | 100.0 /100 | #5 | Exceptional 86.9% |
| Slovenes | 100.0 /100 | #6 | Exceptional 86.4% |
| Immigrants | Bosnia and Herzegovina | 100.0 /100 | #7 | Exceptional 86.3% |
| Immigrants | Cabo Verde | 100.0 /100 | #8 | Exceptional 86.2% |
| Ethiopians | 100.0 /100 | #9 | Exceptional 86.2% |
| Liberians | 100.0 /100 | #10 | Exceptional 86.1% |
| Immigrants | Ethiopia | 100.0 /100 | #11 | Exceptional 86.1% |
| Immigrants | Lithuania | 100.0 /100 | #12 | Exceptional 86.1% |
| Norwegians | 100.0 /100 | #13 | Exceptional 86.1% |
| Latvians | 100.0 /100 | #14 | Exceptional 86.1% |
| Bolivians | 100.0 /100 | #15 | Exceptional 86.1% |
Demographics Similar to Native Hawaiians by In Labor Force | Age 25-29
In terms of in labor force | age 25-29, the demographic groups most similar to Native Hawaiians are Immigrants from Nicaragua (82.9%, a difference of 0.010%), Potawatomi (82.9%, a difference of 0.010%), Fijian (82.9%, a difference of 0.010%), Immigrants from Latin America (82.9%, a difference of 0.020%), and Nepalese (82.9%, a difference of 0.020%).
| Demographics | Rating | Rank | In Labor Force | Age 25-29 |
| Hawaiians | 0.0 /100 | #291 | Tragic 83.0% |
| Immigrants | Guyana | 0.0 /100 | #292 | Tragic 83.0% |
| Immigrants | Latin America | 0.0 /100 | #293 | Tragic 82.9% |
| Nepalese | 0.0 /100 | #294 | Tragic 82.9% |
| Chippewa | 0.0 /100 | #295 | Tragic 82.9% |
| Immigrants | Nicaragua | 0.0 /100 | #296 | Tragic 82.9% |
| Potawatomi | 0.0 /100 | #297 | Tragic 82.9% |
| Native Hawaiians | 0.0 /100 | #298 | Tragic 82.9% |
| Fijians | 0.0 /100 | #299 | Tragic 82.9% |
| Spanish American Indians | 0.0 /100 | #300 | Tragic 82.9% |
| Vietnamese | 0.0 /100 | #301 | Tragic 82.8% |
| Immigrants | Belize | 0.0 /100 | #302 | Tragic 82.8% |
| Immigrants | Grenada | 0.0 /100 | #303 | Tragic 82.8% |
| Immigrants | St. Vincent and the Grenadines | 0.0 /100 | #304 | Tragic 82.7% |
| Blacks/African Americans | 0.0 /100 | #305 | Tragic 82.6% |