Immigrants from Cuba vs Laotian In Labor Force | Age 35-44
COMPARE
Immigrants from Cuba
Laotian
In Labor Force | Age 35-44
In Labor Force | Age 35-44 Comparison
Immigrants from Cuba
Laotians
84.9%
IN LABOR FORCE | AGE 35-44
98.6/ 100
METRIC RATING
76th/ 347
METRIC RANK
84.2%
IN LABOR FORCE | AGE 35-44
19.0/ 100
METRIC RATING
207th/ 347
METRIC RANK
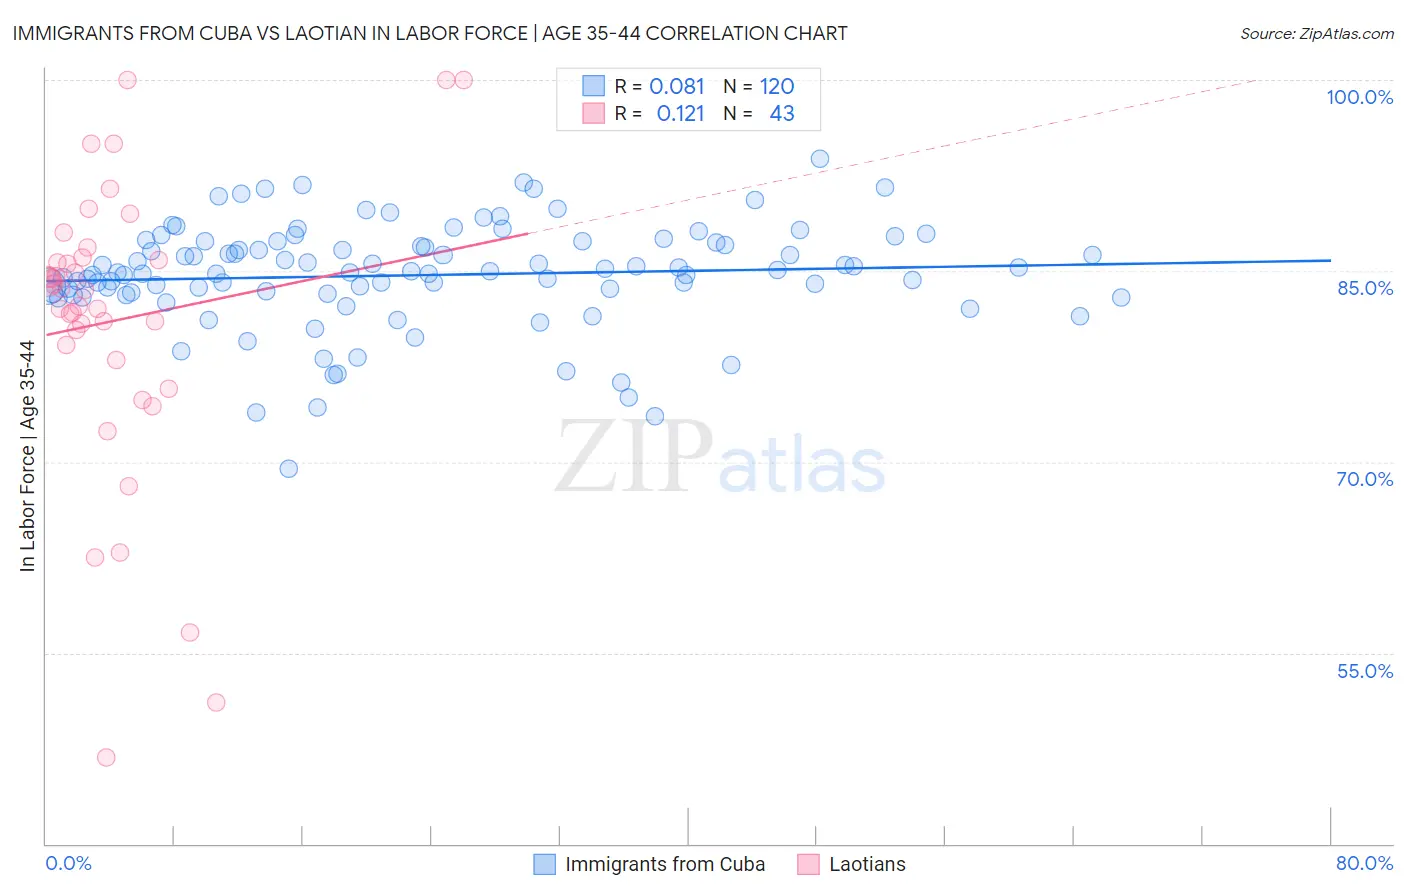
Immigrants from Cuba vs Laotian In Labor Force | Age 35-44 Correlation Chart
The statistical analysis conducted on geographies consisting of 325,923,342 people shows a slight positive correlation between the proportion of Immigrants from Cuba and labor force participation rate among population between the ages 35 and 44 in the United States with a correlation coefficient (R) of 0.081 and weighted average of 84.9%. Similarly, the statistical analysis conducted on geographies consisting of 224,767,288 people shows a poor positive correlation between the proportion of Laotians and labor force participation rate among population between the ages 35 and 44 in the United States with a correlation coefficient (R) of 0.121 and weighted average of 84.2%, a difference of 0.92%.
In Labor Force | Age 35-44 Correlation Summary
| Measurement | Immigrants from Cuba | Laotian |
| Minimum | 69.5% | 46.8% |
| Maximum | 93.8% | 100.0% |
| Range | 24.3% | 53.2% |
| Mean | 84.7% | 81.1% |
| Median | 85.0% | 83.5% |
| Interquartile 25% (IQ1) | 83.2% | 78.0% |
| Interquartile 75% (IQ3) | 87.3% | 86.1% |
| Interquartile Range (IQR) | 4.0% | 8.0% |
| Standard Deviation (Sample) | 4.2% | 11.6% |
| Standard Deviation (Population) | 4.1% | 11.5% |
Similar Demographics by In Labor Force | Age 35-44
Demographics Similar to Immigrants from Cuba by In Labor Force | Age 35-44
In terms of in labor force | age 35-44, the demographic groups most similar to Immigrants from Cuba are Immigrants from Turkey (84.9%, a difference of 0.0%), Immigrants from South Central Asia (85.0%, a difference of 0.010%), Colombian (85.0%, a difference of 0.020%), Immigrants from Singapore (85.0%, a difference of 0.030%), and Immigrants from Sri Lanka (85.0%, a difference of 0.030%).
| Demographics | Rating | Rank | In Labor Force | Age 35-44 |
| Sudanese | 99.0 /100 | #69 | Exceptional 85.0% |
| Brazilians | 99.0 /100 | #70 | Exceptional 85.0% |
| Russians | 99.0 /100 | #71 | Exceptional 85.0% |
| Immigrants | Singapore | 98.9 /100 | #72 | Exceptional 85.0% |
| Immigrants | Sri Lanka | 98.9 /100 | #73 | Exceptional 85.0% |
| Colombians | 98.8 /100 | #74 | Exceptional 85.0% |
| Immigrants | South Central Asia | 98.7 /100 | #75 | Exceptional 85.0% |
| Immigrants | Cuba | 98.6 /100 | #76 | Exceptional 84.9% |
| Immigrants | Turkey | 98.6 /100 | #77 | Exceptional 84.9% |
| Immigrants | Africa | 98.4 /100 | #78 | Exceptional 84.9% |
| Peruvians | 98.3 /100 | #79 | Exceptional 84.9% |
| Immigrants | Colombia | 98.3 /100 | #80 | Exceptional 84.9% |
| Immigrants | Eastern Europe | 98.3 /100 | #81 | Exceptional 84.9% |
| Immigrants | Sudan | 98.1 /100 | #82 | Exceptional 84.9% |
| Senegalese | 97.8 /100 | #83 | Exceptional 84.9% |
Demographics Similar to Laotians by In Labor Force | Age 35-44
In terms of in labor force | age 35-44, the demographic groups most similar to Laotians are Immigrants from Costa Rica (84.2%, a difference of 0.0%), Canadian (84.2%, a difference of 0.010%), Immigrants from Canada (84.2%, a difference of 0.010%), Immigrants from North America (84.2%, a difference of 0.010%), and Swiss (84.2%, a difference of 0.020%).
| Demographics | Rating | Rank | In Labor Force | Age 35-44 |
| Moroccans | 23.2 /100 | #200 | Fair 84.2% |
| British | 23.0 /100 | #201 | Fair 84.2% |
| Immigrants | Uzbekistan | 22.8 /100 | #202 | Fair 84.2% |
| Immigrants | South Eastern Asia | 22.4 /100 | #203 | Fair 84.2% |
| Canadians | 19.9 /100 | #204 | Poor 84.2% |
| Immigrants | Canada | 19.6 /100 | #205 | Poor 84.2% |
| Immigrants | Costa Rica | 19.5 /100 | #206 | Poor 84.2% |
| Laotians | 19.0 /100 | #207 | Poor 84.2% |
| Immigrants | North America | 18.1 /100 | #208 | Poor 84.2% |
| Swiss | 17.4 /100 | #209 | Poor 84.2% |
| New Zealanders | 16.2 /100 | #210 | Poor 84.1% |
| Immigrants | Ecuador | 15.2 /100 | #211 | Poor 84.1% |
| Israelis | 14.0 /100 | #212 | Poor 84.1% |
| Bangladeshis | 13.7 /100 | #213 | Poor 84.1% |
| Immigrants | Barbados | 13.2 /100 | #214 | Poor 84.1% |