Immigrants from Cuba vs Maltese In Labor Force | Age 35-44
COMPARE
Immigrants from Cuba
Maltese
In Labor Force | Age 35-44
In Labor Force | Age 35-44 Comparison
Immigrants from Cuba
Maltese
84.9%
IN LABOR FORCE | AGE 35-44
98.6/ 100
METRIC RATING
76th/ 347
METRIC RANK
84.7%
IN LABOR FORCE | AGE 35-44
90.8/ 100
METRIC RATING
125th/ 347
METRIC RANK
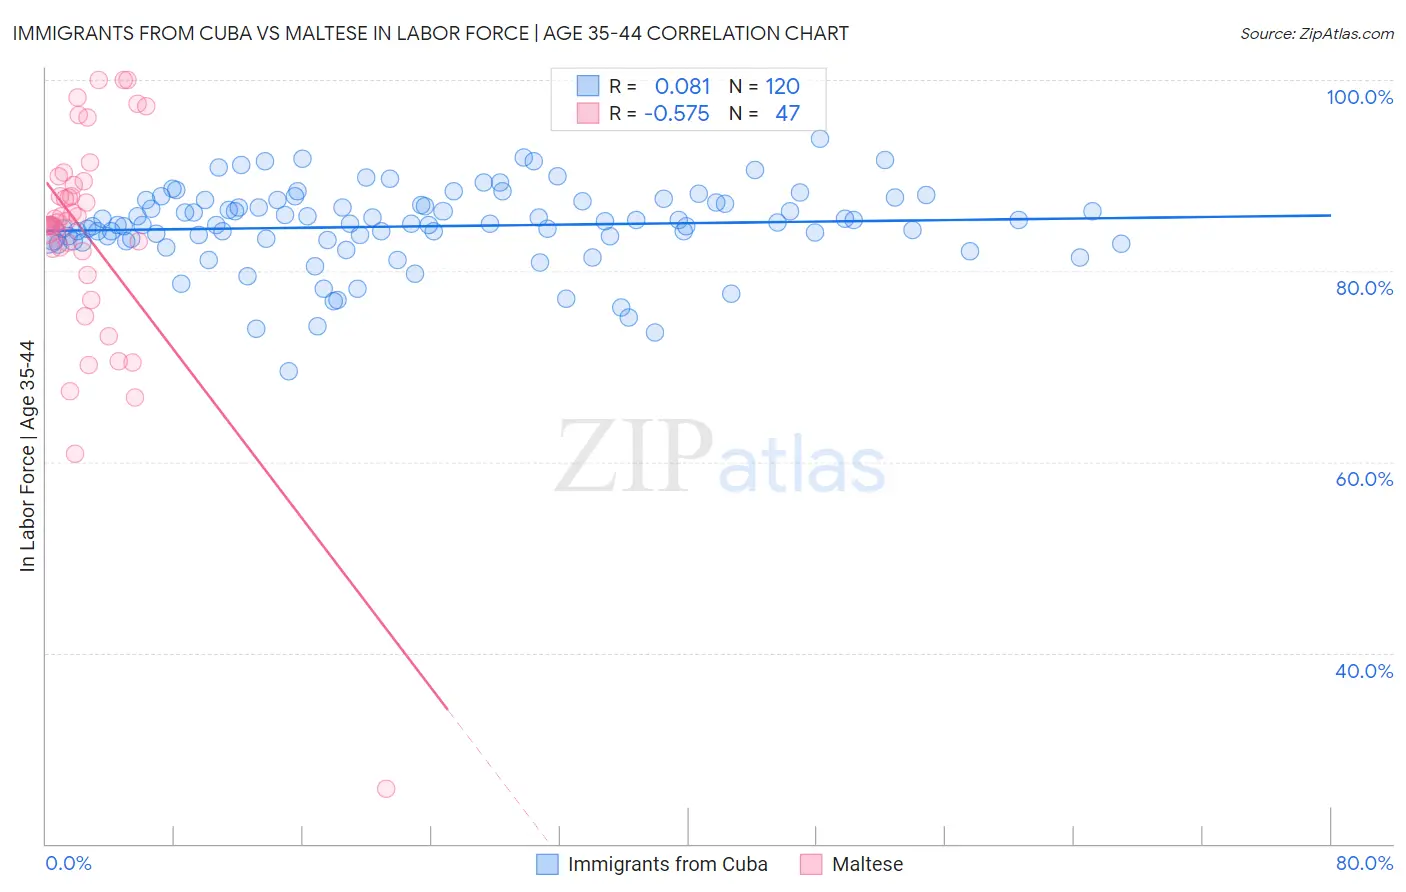
Immigrants from Cuba vs Maltese In Labor Force | Age 35-44 Correlation Chart
The statistical analysis conducted on geographies consisting of 325,923,342 people shows a slight positive correlation between the proportion of Immigrants from Cuba and labor force participation rate among population between the ages 35 and 44 in the United States with a correlation coefficient (R) of 0.081 and weighted average of 84.9%. Similarly, the statistical analysis conducted on geographies consisting of 126,440,103 people shows a substantial negative correlation between the proportion of Maltese and labor force participation rate among population between the ages 35 and 44 in the United States with a correlation coefficient (R) of -0.575 and weighted average of 84.7%, a difference of 0.32%.
In Labor Force | Age 35-44 Correlation Summary
| Measurement | Immigrants from Cuba | Maltese |
| Minimum | 69.5% | 25.7% |
| Maximum | 93.8% | 100.0% |
| Range | 24.3% | 74.3% |
| Mean | 84.7% | 83.6% |
| Median | 85.0% | 85.1% |
| Interquartile 25% (IQ1) | 83.2% | 82.1% |
| Interquartile 75% (IQ3) | 87.3% | 89.4% |
| Interquartile Range (IQR) | 4.0% | 7.3% |
| Standard Deviation (Sample) | 4.2% | 12.5% |
| Standard Deviation (Population) | 4.1% | 12.4% |
Similar Demographics by In Labor Force | Age 35-44
Demographics Similar to Immigrants from Cuba by In Labor Force | Age 35-44
In terms of in labor force | age 35-44, the demographic groups most similar to Immigrants from Cuba are Immigrants from Turkey (84.9%, a difference of 0.0%), Immigrants from South Central Asia (85.0%, a difference of 0.010%), Colombian (85.0%, a difference of 0.020%), Immigrants from Singapore (85.0%, a difference of 0.030%), and Immigrants from Sri Lanka (85.0%, a difference of 0.030%).
| Demographics | Rating | Rank | In Labor Force | Age 35-44 |
| Sudanese | 99.0 /100 | #69 | Exceptional 85.0% |
| Brazilians | 99.0 /100 | #70 | Exceptional 85.0% |
| Russians | 99.0 /100 | #71 | Exceptional 85.0% |
| Immigrants | Singapore | 98.9 /100 | #72 | Exceptional 85.0% |
| Immigrants | Sri Lanka | 98.9 /100 | #73 | Exceptional 85.0% |
| Colombians | 98.8 /100 | #74 | Exceptional 85.0% |
| Immigrants | South Central Asia | 98.7 /100 | #75 | Exceptional 85.0% |
| Immigrants | Cuba | 98.6 /100 | #76 | Exceptional 84.9% |
| Immigrants | Turkey | 98.6 /100 | #77 | Exceptional 84.9% |
| Immigrants | Africa | 98.4 /100 | #78 | Exceptional 84.9% |
| Peruvians | 98.3 /100 | #79 | Exceptional 84.9% |
| Immigrants | Colombia | 98.3 /100 | #80 | Exceptional 84.9% |
| Immigrants | Eastern Europe | 98.3 /100 | #81 | Exceptional 84.9% |
| Immigrants | Sudan | 98.1 /100 | #82 | Exceptional 84.9% |
| Senegalese | 97.8 /100 | #83 | Exceptional 84.9% |
Demographics Similar to Maltese by In Labor Force | Age 35-44
In terms of in labor force | age 35-44, the demographic groups most similar to Maltese are Immigrants from South America (84.7%, a difference of 0.0%), Slavic (84.7%, a difference of 0.0%), Asian (84.7%, a difference of 0.0%), Immigrants from Spain (84.7%, a difference of 0.0%), and Finnish (84.7%, a difference of 0.010%).
| Demographics | Rating | Rank | In Labor Force | Age 35-44 |
| Immigrants | Eastern Asia | 92.1 /100 | #118 | Exceptional 84.7% |
| Burmese | 91.8 /100 | #119 | Exceptional 84.7% |
| Immigrants | Northern Europe | 91.5 /100 | #120 | Exceptional 84.7% |
| Finns | 91.2 /100 | #121 | Exceptional 84.7% |
| Germans | 91.0 /100 | #122 | Exceptional 84.7% |
| Immigrants | South America | 90.9 /100 | #123 | Exceptional 84.7% |
| Slavs | 90.8 /100 | #124 | Exceptional 84.7% |
| Maltese | 90.8 /100 | #125 | Exceptional 84.7% |
| Asians | 90.6 /100 | #126 | Exceptional 84.7% |
| Immigrants | Spain | 90.6 /100 | #127 | Exceptional 84.7% |
| Immigrants | Ghana | 90.4 /100 | #128 | Exceptional 84.7% |
| Palestinians | 89.7 /100 | #129 | Excellent 84.7% |
| Bhutanese | 89.7 /100 | #130 | Excellent 84.7% |
| Immigrants | Scotland | 89.6 /100 | #131 | Excellent 84.7% |
| Austrians | 89.4 /100 | #132 | Excellent 84.7% |