Immigrants from Cuba vs Laotian Master's Degree
COMPARE
Immigrants from Cuba
Laotian
Master's Degree
Master's Degree Comparison
Immigrants from Cuba
Laotians
10.9%
MASTER'S DEGREE
0.0/ 100
METRIC RATING
318th/ 347
METRIC RANK
17.0%
MASTER'S DEGREE
98.8/ 100
METRIC RATING
99th/ 347
METRIC RANK
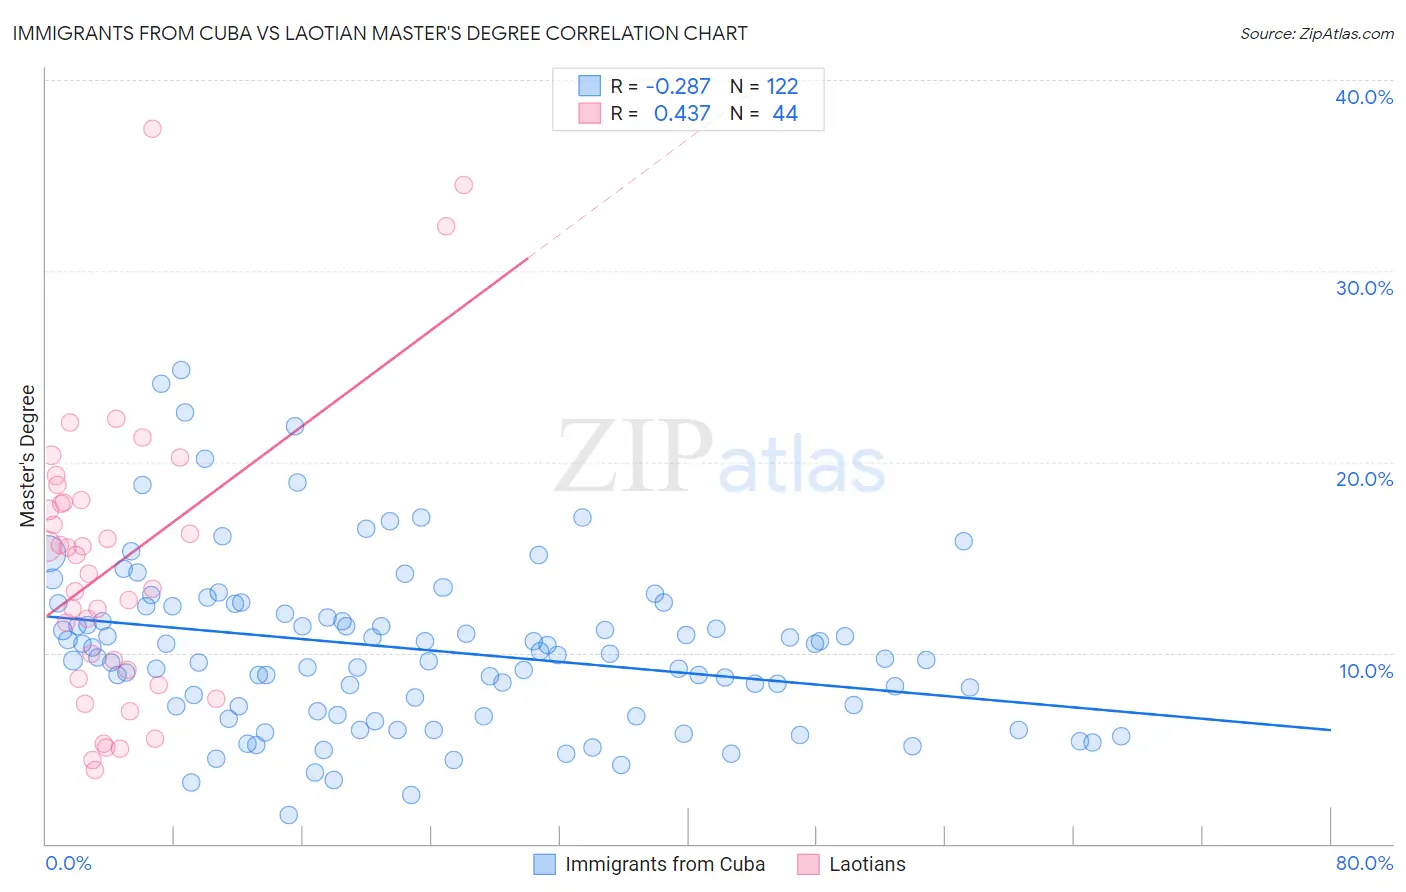
Immigrants from Cuba vs Laotian Master's Degree Correlation Chart
The statistical analysis conducted on geographies consisting of 325,858,973 people shows a weak negative correlation between the proportion of Immigrants from Cuba and percentage of population with at least master's degree education in the United States with a correlation coefficient (R) of -0.287 and weighted average of 10.9%. Similarly, the statistical analysis conducted on geographies consisting of 224,808,170 people shows a moderate positive correlation between the proportion of Laotians and percentage of population with at least master's degree education in the United States with a correlation coefficient (R) of 0.437 and weighted average of 17.0%, a difference of 56.8%.
Master's Degree Correlation Summary
| Measurement | Immigrants from Cuba | Laotian |
| Minimum | 1.5% | 3.9% |
| Maximum | 24.8% | 37.4% |
| Range | 23.3% | 33.6% |
| Mean | 10.2% | 14.6% |
| Median | 9.8% | 14.6% |
| Interquartile 25% (IQ1) | 6.9% | 8.9% |
| Interquartile 75% (IQ3) | 12.4% | 17.9% |
| Interquartile Range (IQR) | 5.5% | 9.1% |
| Standard Deviation (Sample) | 4.4% | 7.6% |
| Standard Deviation (Population) | 4.4% | 7.5% |
Similar Demographics by Master's Degree
Demographics Similar to Immigrants from Cuba by Master's Degree
In terms of master's degree, the demographic groups most similar to Immigrants from Cuba are Hopi (10.9%, a difference of 0.13%), Kiowa (10.8%, a difference of 0.24%), Hispanic or Latino (10.9%, a difference of 0.67%), Immigrants from Micronesia (10.8%, a difference of 0.86%), and Cajun (11.0%, a difference of 1.0%).
| Demographics | Rating | Rank | Master's Degree |
| Seminole | 0.0 /100 | #311 | Tragic 11.0% |
| Choctaw | 0.0 /100 | #312 | Tragic 11.0% |
| Yaqui | 0.0 /100 | #313 | Tragic 11.0% |
| Cajuns | 0.0 /100 | #314 | Tragic 11.0% |
| Apache | 0.0 /100 | #315 | Tragic 11.0% |
| Hispanics or Latinos | 0.0 /100 | #316 | Tragic 10.9% |
| Hopi | 0.0 /100 | #317 | Tragic 10.9% |
| Immigrants | Cuba | 0.0 /100 | #318 | Tragic 10.9% |
| Kiowa | 0.0 /100 | #319 | Tragic 10.8% |
| Immigrants | Micronesia | 0.0 /100 | #320 | Tragic 10.8% |
| Pennsylvania Germans | 0.0 /100 | #321 | Tragic 10.7% |
| Sioux | 0.0 /100 | #322 | Tragic 10.7% |
| Crow | 0.0 /100 | #323 | Tragic 10.6% |
| Dutch West Indians | 0.0 /100 | #324 | Tragic 10.6% |
| Inupiat | 0.0 /100 | #325 | Tragic 10.5% |
Demographics Similar to Laotians by Master's Degree
In terms of master's degree, the demographic groups most similar to Laotians are Immigrants from Ukraine (17.0%, a difference of 0.060%), Immigrants from England (17.0%, a difference of 0.15%), Albanian (17.0%, a difference of 0.21%), Immigrants from Northern Africa (17.1%, a difference of 0.32%), and Immigrants from Morocco (17.1%, a difference of 0.35%).
| Demographics | Rating | Rank | Master's Degree |
| Immigrants | North America | 99.1 /100 | #92 | Exceptional 17.2% |
| Immigrants | Italy | 99.1 /100 | #93 | Exceptional 17.2% |
| Ugandans | 99.0 /100 | #94 | Exceptional 17.1% |
| Immigrants | Morocco | 98.9 /100 | #95 | Exceptional 17.1% |
| Immigrants | Northern Africa | 98.9 /100 | #96 | Exceptional 17.1% |
| Immigrants | England | 98.8 /100 | #97 | Exceptional 17.0% |
| Immigrants | Ukraine | 98.8 /100 | #98 | Exceptional 17.0% |
| Laotians | 98.8 /100 | #99 | Exceptional 17.0% |
| Albanians | 98.7 /100 | #100 | Exceptional 17.0% |
| Immigrants | Nepal | 98.6 /100 | #101 | Exceptional 17.0% |
| Chileans | 98.6 /100 | #102 | Exceptional 16.9% |
| Alsatians | 98.4 /100 | #103 | Exceptional 16.9% |
| Ukrainians | 98.3 /100 | #104 | Exceptional 16.9% |
| Syrians | 98.3 /100 | #105 | Exceptional 16.8% |
| Immigrants | Albania | 98.1 /100 | #106 | Exceptional 16.8% |