White/Caucasian vs Laotian In Labor Force | Age 35-44
COMPARE
White/Caucasian
Laotian
In Labor Force | Age 35-44
In Labor Force | Age 35-44 Comparison
Whites/Caucasians
Laotians
83.6%
IN LABOR FORCE | AGE 35-44
0.5/ 100
METRIC RATING
250th/ 347
METRIC RANK
84.2%
IN LABOR FORCE | AGE 35-44
19.0/ 100
METRIC RATING
207th/ 347
METRIC RANK
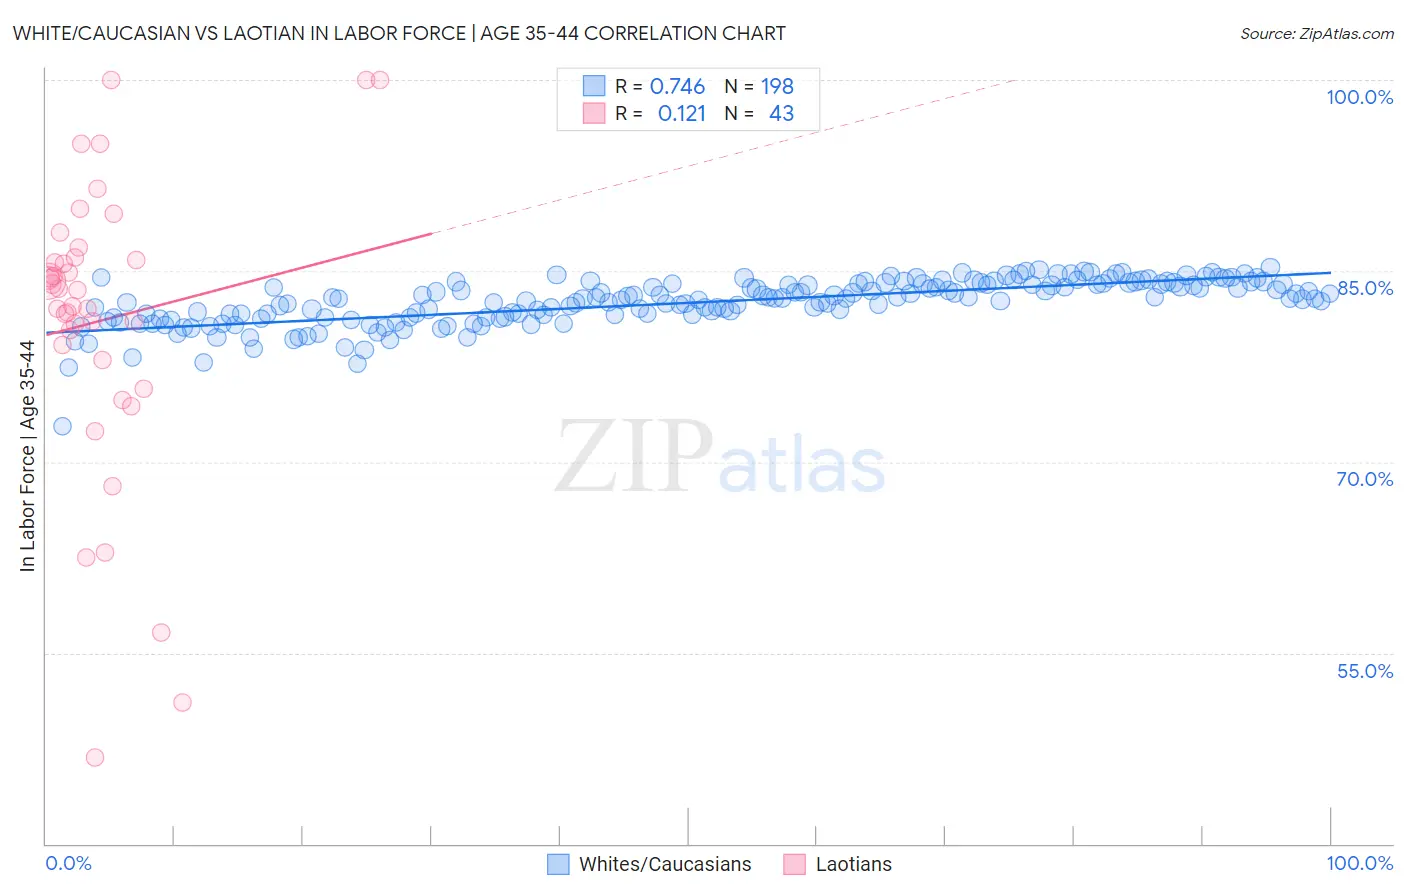
White/Caucasian vs Laotian In Labor Force | Age 35-44 Correlation Chart
The statistical analysis conducted on geographies consisting of 583,820,573 people shows a strong positive correlation between the proportion of Whites/Caucasians and labor force participation rate among population between the ages 35 and 44 in the United States with a correlation coefficient (R) of 0.746 and weighted average of 83.6%. Similarly, the statistical analysis conducted on geographies consisting of 224,767,288 people shows a poor positive correlation between the proportion of Laotians and labor force participation rate among population between the ages 35 and 44 in the United States with a correlation coefficient (R) of 0.121 and weighted average of 84.2%, a difference of 0.63%.
In Labor Force | Age 35-44 Correlation Summary
| Measurement | White/Caucasian | Laotian |
| Minimum | 72.8% | 46.8% |
| Maximum | 85.3% | 100.0% |
| Range | 12.5% | 53.2% |
| Mean | 82.5% | 81.1% |
| Median | 82.8% | 83.5% |
| Interquartile 25% (IQ1) | 81.4% | 78.0% |
| Interquartile 75% (IQ3) | 84.0% | 86.1% |
| Interquartile Range (IQR) | 2.6% | 8.0% |
| Standard Deviation (Sample) | 1.8% | 11.6% |
| Standard Deviation (Population) | 1.8% | 11.5% |
Similar Demographics by In Labor Force | Age 35-44
Demographics Similar to Whites/Caucasians by In Labor Force | Age 35-44
In terms of in labor force | age 35-44, the demographic groups most similar to Whites/Caucasians are Salvadoran (83.6%, a difference of 0.020%), Immigrants from Guyana (83.6%, a difference of 0.020%), Lebanese (83.6%, a difference of 0.020%), Tongan (83.6%, a difference of 0.030%), and Immigrants from St. Vincent and the Grenadines (83.7%, a difference of 0.060%).
| Demographics | Rating | Rank | In Labor Force | Age 35-44 |
| Immigrants | Western Asia | 1.1 /100 | #243 | Tragic 83.8% |
| Guyanese | 1.1 /100 | #244 | Tragic 83.8% |
| Malaysians | 1.1 /100 | #245 | Tragic 83.8% |
| Immigrants | Immigrants | 1.0 /100 | #246 | Tragic 83.7% |
| Immigrants | Armenia | 0.9 /100 | #247 | Tragic 83.7% |
| Indonesians | 0.8 /100 | #248 | Tragic 83.7% |
| Immigrants | St. Vincent and the Grenadines | 0.7 /100 | #249 | Tragic 83.7% |
| Whites/Caucasians | 0.5 /100 | #250 | Tragic 83.6% |
| Salvadorans | 0.4 /100 | #251 | Tragic 83.6% |
| Immigrants | Guyana | 0.4 /100 | #252 | Tragic 83.6% |
| Lebanese | 0.4 /100 | #253 | Tragic 83.6% |
| Tongans | 0.4 /100 | #254 | Tragic 83.6% |
| Immigrants | Azores | 0.3 /100 | #255 | Tragic 83.6% |
| Japanese | 0.3 /100 | #256 | Tragic 83.6% |
| Basques | 0.3 /100 | #257 | Tragic 83.6% |
Demographics Similar to Laotians by In Labor Force | Age 35-44
In terms of in labor force | age 35-44, the demographic groups most similar to Laotians are Immigrants from Costa Rica (84.2%, a difference of 0.0%), Canadian (84.2%, a difference of 0.010%), Immigrants from Canada (84.2%, a difference of 0.010%), Immigrants from North America (84.2%, a difference of 0.010%), and Swiss (84.2%, a difference of 0.020%).
| Demographics | Rating | Rank | In Labor Force | Age 35-44 |
| Moroccans | 23.2 /100 | #200 | Fair 84.2% |
| British | 23.0 /100 | #201 | Fair 84.2% |
| Immigrants | Uzbekistan | 22.8 /100 | #202 | Fair 84.2% |
| Immigrants | South Eastern Asia | 22.4 /100 | #203 | Fair 84.2% |
| Canadians | 19.9 /100 | #204 | Poor 84.2% |
| Immigrants | Canada | 19.6 /100 | #205 | Poor 84.2% |
| Immigrants | Costa Rica | 19.5 /100 | #206 | Poor 84.2% |
| Laotians | 19.0 /100 | #207 | Poor 84.2% |
| Immigrants | North America | 18.1 /100 | #208 | Poor 84.2% |
| Swiss | 17.4 /100 | #209 | Poor 84.2% |
| New Zealanders | 16.2 /100 | #210 | Poor 84.1% |
| Immigrants | Ecuador | 15.2 /100 | #211 | Poor 84.1% |
| Israelis | 14.0 /100 | #212 | Poor 84.1% |
| Bangladeshis | 13.7 /100 | #213 | Poor 84.1% |
| Immigrants | Barbados | 13.2 /100 | #214 | Poor 84.1% |