Nicaraguan vs Immigrants from Vietnam In Labor Force | Age 16-19
COMPARE
Nicaraguan
Immigrants from Vietnam
In Labor Force | Age 16-19
In Labor Force | Age 16-19 Comparison
Nicaraguans
Immigrants from Vietnam
32.4%
IN LABOR FORCE | AGE 16-19
0.0/ 100
METRIC RATING
305th/ 347
METRIC RANK
35.0%
IN LABOR FORCE | AGE 16-19
3.4/ 100
METRIC RATING
238th/ 347
METRIC RANK
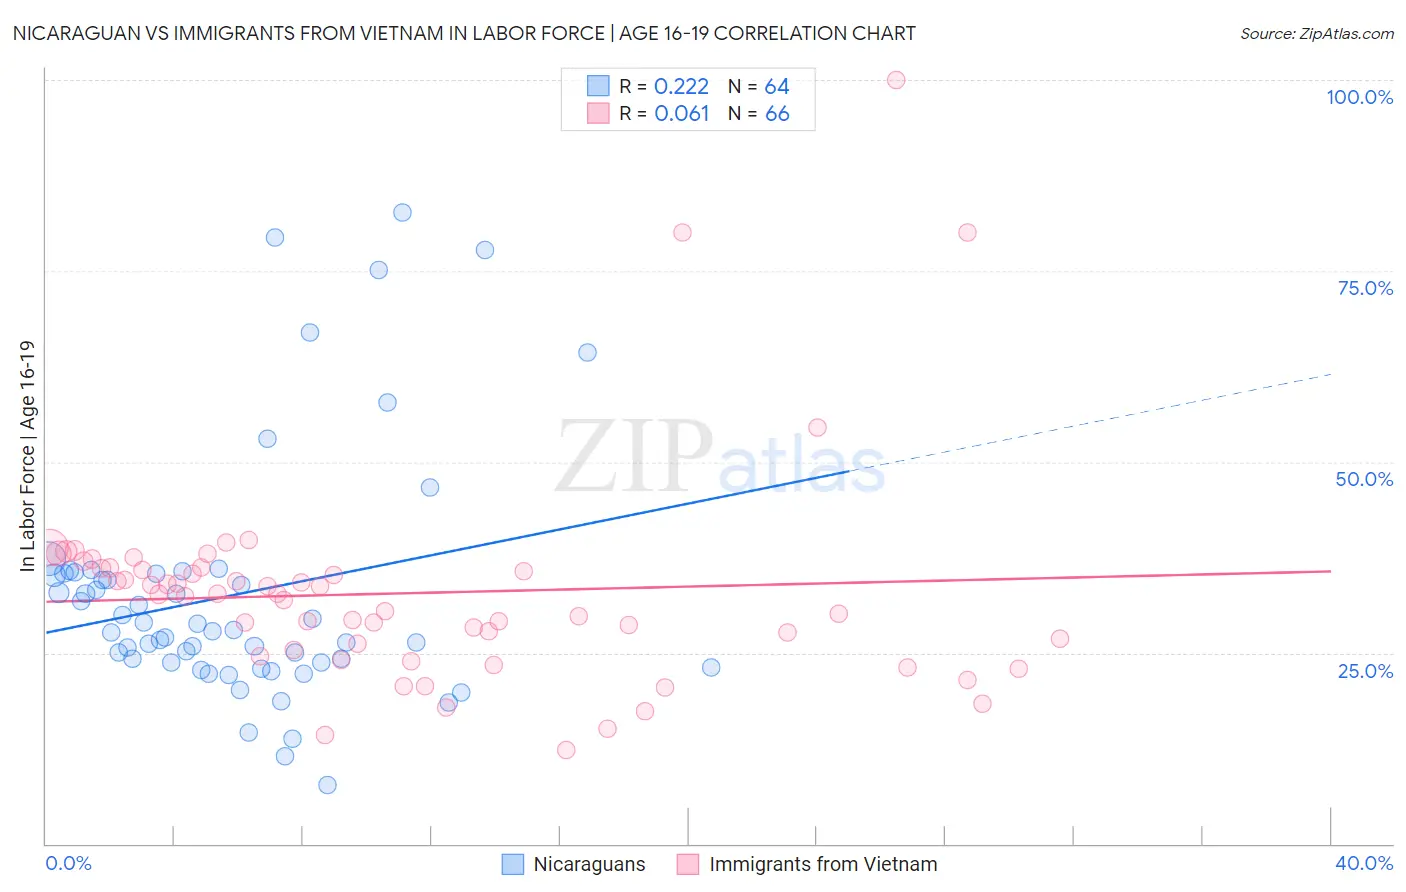
Nicaraguan vs Immigrants from Vietnam In Labor Force | Age 16-19 Correlation Chart
The statistical analysis conducted on geographies consisting of 285,526,863 people shows a weak positive correlation between the proportion of Nicaraguans and labor force participation rate among population between the ages 16 and 19 in the United States with a correlation coefficient (R) of 0.222 and weighted average of 32.4%. Similarly, the statistical analysis conducted on geographies consisting of 404,448,042 people shows a slight positive correlation between the proportion of Immigrants from Vietnam and labor force participation rate among population between the ages 16 and 19 in the United States with a correlation coefficient (R) of 0.061 and weighted average of 35.0%, a difference of 8.1%.
In Labor Force | Age 16-19 Correlation Summary
| Measurement | Nicaraguan | Immigrants from Vietnam |
| Minimum | 7.7% | 12.3% |
| Maximum | 82.6% | 100.0% |
| Range | 74.9% | 87.7% |
| Mean | 32.6% | 32.8% |
| Median | 27.9% | 32.5% |
| Interquartile 25% (IQ1) | 23.7% | 25.3% |
| Interquartile 75% (IQ3) | 35.4% | 36.1% |
| Interquartile Range (IQR) | 11.7% | 10.7% |
| Standard Deviation (Sample) | 16.0% | 14.1% |
| Standard Deviation (Population) | 15.9% | 14.0% |
Similar Demographics by In Labor Force | Age 16-19
Demographics Similar to Nicaraguans by In Labor Force | Age 16-19
In terms of in labor force | age 16-19, the demographic groups most similar to Nicaraguans are Israeli (32.4%, a difference of 0.050%), Spanish American Indian (32.4%, a difference of 0.13%), Immigrants from Dominica (32.5%, a difference of 0.24%), Immigrants from Jamaica (32.2%, a difference of 0.62%), and Navajo (32.1%, a difference of 0.97%).
| Demographics | Rating | Rank | In Labor Force | Age 16-19 |
| Iranians | 0.0 /100 | #298 | Tragic 33.0% |
| Armenians | 0.0 /100 | #299 | Tragic 32.9% |
| Immigrants | Argentina | 0.0 /100 | #300 | Tragic 32.9% |
| Okinawans | 0.0 /100 | #301 | Tragic 32.8% |
| Belizeans | 0.0 /100 | #302 | Tragic 32.8% |
| Immigrants | Dominica | 0.0 /100 | #303 | Tragic 32.5% |
| Israelis | 0.0 /100 | #304 | Tragic 32.4% |
| Nicaraguans | 0.0 /100 | #305 | Tragic 32.4% |
| Spanish American Indians | 0.0 /100 | #306 | Tragic 32.4% |
| Immigrants | Jamaica | 0.0 /100 | #307 | Tragic 32.2% |
| Navajo | 0.0 /100 | #308 | Tragic 32.1% |
| Immigrants | Eastern Asia | 0.0 /100 | #309 | Tragic 32.0% |
| Immigrants | Iran | 0.0 /100 | #310 | Tragic 32.0% |
| Indians (Asian) | 0.0 /100 | #311 | Tragic 31.9% |
| Immigrants | Belize | 0.0 /100 | #312 | Tragic 31.8% |
Demographics Similar to Immigrants from Vietnam by In Labor Force | Age 16-19
In terms of in labor force | age 16-19, the demographic groups most similar to Immigrants from Vietnam are Immigrants from India (35.0%, a difference of 0.050%), Immigrants from Australia (35.1%, a difference of 0.070%), Inupiat (35.0%, a difference of 0.090%), Immigrants from Central America (35.0%, a difference of 0.19%), and Immigrants from Philippines (35.1%, a difference of 0.21%).
| Demographics | Rating | Rank | In Labor Force | Age 16-19 |
| Immigrants | Syria | 4.5 /100 | #231 | Tragic 35.2% |
| Immigrants | Kazakhstan | 4.5 /100 | #232 | Tragic 35.2% |
| Immigrants | France | 4.3 /100 | #233 | Tragic 35.1% |
| Immigrants | Mexico | 4.2 /100 | #234 | Tragic 35.1% |
| Immigrants | Philippines | 4.0 /100 | #235 | Tragic 35.1% |
| Immigrants | Australia | 3.6 /100 | #236 | Tragic 35.1% |
| Immigrants | India | 3.5 /100 | #237 | Tragic 35.0% |
| Immigrants | Vietnam | 3.4 /100 | #238 | Tragic 35.0% |
| Inupiat | 3.2 /100 | #239 | Tragic 35.0% |
| Immigrants | Central America | 3.0 /100 | #240 | Tragic 35.0% |
| Immigrants | Ireland | 2.9 /100 | #241 | Tragic 35.0% |
| Uruguayans | 2.6 /100 | #242 | Tragic 34.9% |
| Pueblo | 2.6 /100 | #243 | Tragic 34.9% |
| Immigrants | Turkey | 2.6 /100 | #244 | Tragic 34.9% |
| Immigrants | Greece | 2.4 /100 | #245 | Tragic 34.9% |