Immigrants from Costa Rica vs South American Indian In Labor Force | Age 20-24
COMPARE
Immigrants from Costa Rica
South American Indian
In Labor Force | Age 20-24
In Labor Force | Age 20-24 Comparison
Immigrants from Costa Rica
South American Indians
74.9%
IN LABOR FORCE | AGE 20-24
36.7/ 100
METRIC RATING
183rd/ 347
METRIC RANK
75.3%
IN LABOR FORCE | AGE 20-24
69.0/ 100
METRIC RATING
159th/ 347
METRIC RANK
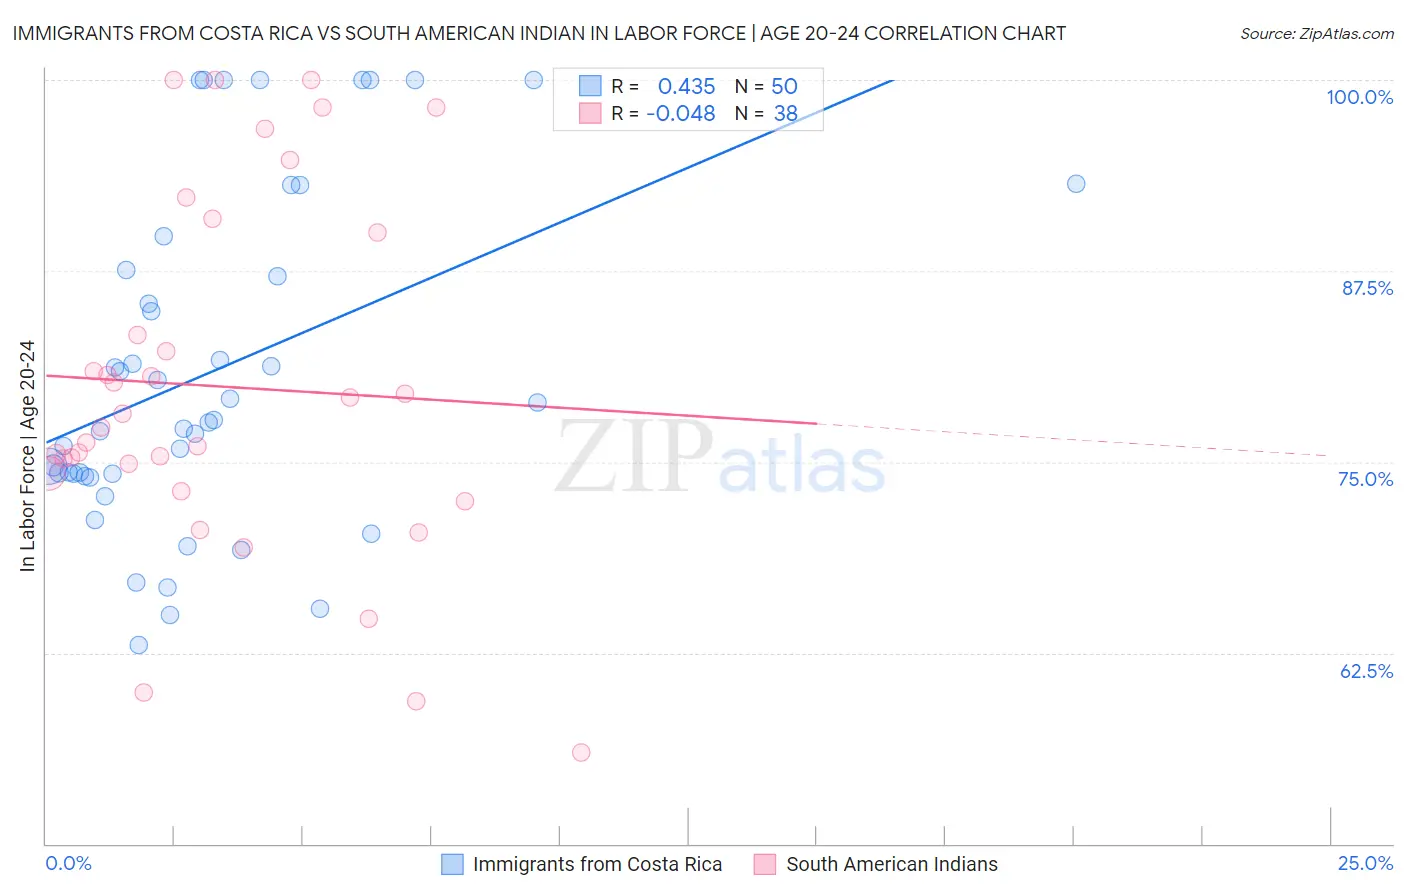
Immigrants from Costa Rica vs South American Indian In Labor Force | Age 20-24 Correlation Chart
The statistical analysis conducted on geographies consisting of 204,265,207 people shows a moderate positive correlation between the proportion of Immigrants from Costa Rica and labor force participation rate among population between the ages 20 and 24 in the United States with a correlation coefficient (R) of 0.435 and weighted average of 74.9%. Similarly, the statistical analysis conducted on geographies consisting of 164,558,708 people shows no correlation between the proportion of South American Indians and labor force participation rate among population between the ages 20 and 24 in the United States with a correlation coefficient (R) of -0.048 and weighted average of 75.3%, a difference of 0.49%.
In Labor Force | Age 20-24 Correlation Summary
| Measurement | Immigrants from Costa Rica | South American Indian |
| Minimum | 63.0% | 56.0% |
| Maximum | 100.0% | 100.0% |
| Range | 37.0% | 44.0% |
| Mean | 80.9% | 79.9% |
| Median | 77.7% | 77.7% |
| Interquartile 25% (IQ1) | 74.2% | 74.3% |
| Interquartile 75% (IQ3) | 87.6% | 90.0% |
| Interquartile Range (IQR) | 13.4% | 15.7% |
| Standard Deviation (Sample) | 10.9% | 11.6% |
| Standard Deviation (Population) | 10.8% | 11.5% |
Similar Demographics by In Labor Force | Age 20-24
Demographics Similar to Immigrants from Costa Rica by In Labor Force | Age 20-24
In terms of in labor force | age 20-24, the demographic groups most similar to Immigrants from Costa Rica are Immigrants from South Africa (74.9%, a difference of 0.0%), Immigrants from Hungary (74.9%, a difference of 0.030%), Sri Lankan (74.9%, a difference of 0.030%), Immigrants from Eastern Europe (74.9%, a difference of 0.050%), and Immigrants from Honduras (74.9%, a difference of 0.050%).
| Demographics | Rating | Rank | In Labor Force | Age 20-24 |
| Central Americans | 48.7 /100 | #176 | Average 75.0% |
| Immigrants | Mexico | 47.8 /100 | #177 | Average 75.0% |
| Immigrants | Central America | 45.0 /100 | #178 | Average 75.0% |
| Immigrants | Latvia | 44.1 /100 | #179 | Average 75.0% |
| Immigrants | Czechoslovakia | 44.0 /100 | #180 | Average 75.0% |
| Africans | 42.5 /100 | #181 | Average 75.0% |
| Immigrants | South Africa | 36.9 /100 | #182 | Fair 74.9% |
| Immigrants | Costa Rica | 36.7 /100 | #183 | Fair 74.9% |
| Immigrants | Hungary | 35.0 /100 | #184 | Fair 74.9% |
| Sri Lankans | 34.9 /100 | #185 | Fair 74.9% |
| Immigrants | Eastern Europe | 33.8 /100 | #186 | Fair 74.9% |
| Immigrants | Honduras | 33.5 /100 | #187 | Fair 74.9% |
| Hondurans | 32.7 /100 | #188 | Fair 74.8% |
| Immigrants | Northern Europe | 32.6 /100 | #189 | Fair 74.8% |
| Russians | 32.2 /100 | #190 | Fair 74.8% |
Demographics Similar to South American Indians by In Labor Force | Age 20-24
In terms of in labor force | age 20-24, the demographic groups most similar to South American Indians are Japanese (75.3%, a difference of 0.010%), Immigrants from Bolivia (75.3%, a difference of 0.030%), Immigrants from Western Europe (75.3%, a difference of 0.040%), Immigrants from Guatemala (75.3%, a difference of 0.050%), and Immigrants from El Salvador (75.3%, a difference of 0.050%).
| Demographics | Rating | Rank | In Labor Force | Age 20-24 |
| Lebanese | 73.5 /100 | #152 | Good 75.3% |
| Guatemalans | 72.3 /100 | #153 | Good 75.3% |
| Osage | 72.3 /100 | #154 | Good 75.3% |
| Immigrants | Guatemala | 71.9 /100 | #155 | Good 75.3% |
| Immigrants | El Salvador | 71.7 /100 | #156 | Good 75.3% |
| Immigrants | Western Europe | 71.5 /100 | #157 | Good 75.3% |
| Immigrants | Bolivia | 71.0 /100 | #158 | Good 75.3% |
| South American Indians | 69.0 /100 | #159 | Good 75.3% |
| Japanese | 68.7 /100 | #160 | Good 75.3% |
| New Zealanders | 65.4 /100 | #161 | Good 75.2% |
| Immigrants | Romania | 64.6 /100 | #162 | Good 75.2% |
| Costa Ricans | 64.2 /100 | #163 | Good 75.2% |
| Bolivians | 64.0 /100 | #164 | Good 75.2% |
| Afghans | 63.5 /100 | #165 | Good 75.2% |
| Cambodians | 60.5 /100 | #166 | Good 75.2% |