Immigrants from Colombia vs Immigrants from Laos Disability Age 35 to 64

COMPARE

Immigrants from Colombia
Race
Ancestry
AfghanAfricanAlaska NativeAlaskan AthabascanAlbanianAleutAlsatianAmericanApacheArabArapahoArgentineanArmenianAssyrian/Chaldean/SyriacAustralianAustrianBahamianBangladeshiBarbadianBasqueBelgianBelizeanBermudanBhutaneseBlackfeetBolivianBrazilianBritishBritish West IndianBulgarianBurmeseCajunCambodianCanadianCape VerdeanCarpatho RusynCelticCentral AmericanCentral American IndianCherokeeCheyenneChickasawChileanChineseChippewaChoctawColombianColvilleComancheCosta RicanCreeCreekCroatianCrowCubanCypriotCzechCzechoslovakianDanishDelawareDominicanDutchDutch West IndianEastern EuropeanEcuadorianEgyptianEnglishEstonianEthiopianEuropeanFijianFilipinoFinnishFrenchFrench American IndianFrench CanadianGermanGerman RussianGhanaianGreekGuamanian/ChamorroGuatemalanGuyaneseHaitianHmongHonduranHopiHoumaHungarianIcelanderIndian (Asian)IndonesianInupiatIranianIraqiIrishIroquoisIsraeliItalianJamaicanJapaneseJordanianKenyanKiowaKoreanLaotianLatvianLebaneseLiberianLithuanianLumbeeLuxembourgerMacedonianMalaysianMalteseMarshalleseMenomineeMexicanMexican American IndianMongolianMoroccanNative HawaiianNavajoNepaleseNew ZealanderNicaraguanNigerianNorthern EuropeanNorwegianOkinawanOsageOttawaPaiutePakistaniPalestinianPanamanianParaguayanPennsylvania GermanPeruvianPimaPolishPortuguesePotawatomiPuebloPuerto RicanPuget Sound SalishRomanianRussianSalvadoranSamoanScandinavianScotch-IrishScottishSeminoleSenegaleseSerbianShoshoneSierra LeoneanSiouxSlavicSlovakSloveneSomaliSouth AfricanSouth AmericanSouth American IndianSoviet UnionSpaniardSpanishSpanish AmericanSpanish American IndianSri LankanSubsaharan AfricanSudaneseSwedishSwissSyrianTaiwaneseThaiTlingit-HaidaTohono O'OdhamTonganTrinidadian and TobagonianTsimshianTurkishU.S. Virgin IslanderUgandanUkrainianUruguayanUteVenezuelanVietnameseWelshWest IndianYakamaYaquiYugoslavianYumanYup'ikZimbabwean
Immigration
NonimmigrantsImmigrantsAfghanistanAfricaAlbaniaArgentinaArmeniaAsiaAustraliaAustriaBahamasBangladeshBarbadosBelarusBelgiumBelizeBoliviaBosnia and HerzegovinaBrazilBulgariaBurma/MyanmarCabo VerdeCambodiaCameroonCanadaCaribbeanCentral AmericaChileChinaColombiaCongoCosta RicaCroatiaCubaCzechoslovakiaDenmarkDominicaDominican RepublicEastern AfricaEastern AsiaEastern EuropeEcuadorEgyptEl SalvadorEnglandEritreaEthiopiaEuropeFijiFranceGermanyGhanaGreeceGrenadaGuatemalaGuyanaHaitiHondurasHong KongHungaryIndiaIndonesiaIranIraqIrelandIsraelItalyJamaicaJapanJordanKazakhstanKenyaKoreaKuwaitLatin AmericaLatviaLebanonLiberiaLithuaniaMalaysiaMexicoMicronesiaMiddle AfricaMoldovaMoroccoNepalNetherlandsNicaraguaNigeriaNorth AmericaNorth MacedoniaNorthern AfricaNorthern EuropeNorwayOceaniaPakistanPanamaPeruPhilippinesPolandPortugalRomaniaRussiaSaudi ArabiaScotlandSenegalSerbiaSierra LeoneSingaporeSomaliaSouth AfricaSouth AmericaSouth Central AsiaSouth Eastern AsiaSouthern EuropeSpainSri LankaSt. Vincent and the GrenadinesSudanSwedenSwitzerlandSyriaTaiwanThailandTrinidad and TobagoTurkeyUgandaUkraineUruguayUzbekistanVenezuelaVietnamWest IndiesWestern AfricaWestern AsiaWestern EuropeYemenZaireZimbabweAzores
Immigrants from Laos
Race
Ancestry
AfghanAfricanAlaska NativeAlaskan AthabascanAlbanianAleutAlsatianAmericanApacheArabArapahoArgentineanArmenianAssyrian/Chaldean/SyriacAustralianAustrianBahamianBangladeshiBarbadianBasqueBelgianBelizeanBermudanBhutaneseBlackfeetBolivianBrazilianBritishBritish West IndianBulgarianBurmeseCajunCambodianCanadianCape VerdeanCarpatho RusynCelticCentral AmericanCentral American IndianCherokeeCheyenneChickasawChileanChineseChippewaChoctawColombianColvilleComancheCosta RicanCreeCreekCroatianCrowCubanCypriotCzechCzechoslovakianDanishDelawareDominicanDutchDutch West IndianEastern EuropeanEcuadorianEgyptianEnglishEstonianEthiopianEuropeanFijianFilipinoFinnishFrenchFrench American IndianFrench CanadianGermanGerman RussianGhanaianGreekGuamanian/ChamorroGuatemalanGuyaneseHaitianHmongHonduranHopiHoumaHungarianIcelanderIndian (Asian)IndonesianInupiatIranianIraqiIrishIroquoisIsraeliItalianJamaicanJapaneseJordanianKenyanKiowaKoreanLaotianLatvianLebaneseLiberianLithuanianLumbeeLuxembourgerMacedonianMalaysianMalteseMarshalleseMenomineeMexicanMexican American IndianMongolianMoroccanNative HawaiianNavajoNepaleseNew ZealanderNicaraguanNigerianNorthern EuropeanNorwegianOkinawanOsageOttawaPaiutePakistaniPalestinianPanamanianParaguayanPennsylvania GermanPeruvianPimaPolishPortuguesePotawatomiPuebloPuerto RicanPuget Sound SalishRomanianRussianSalvadoranSamoanScandinavianScotch-IrishScottishSeminoleSenegaleseSerbianShoshoneSierra LeoneanSiouxSlavicSlovakSloveneSomaliSouth AfricanSouth AmericanSouth American IndianSoviet UnionSpaniardSpanishSpanish AmericanSpanish American IndianSri LankanSubsaharan AfricanSudaneseSwedishSwissSyrianTaiwaneseThaiTlingit-HaidaTohono O'OdhamTonganTrinidadian and TobagonianTsimshianTurkishU.S. Virgin IslanderUgandanUkrainianUruguayanUteVenezuelanVietnameseWelshWest IndianYakamaYaquiYugoslavianYumanYup'ikZimbabwean
Immigration
NonimmigrantsImmigrantsAfghanistanAfricaAlbaniaArgentinaArmeniaAsiaAustraliaAustriaBahamasBangladeshBarbadosBelarusBelgiumBelizeBoliviaBosnia and HerzegovinaBrazilBulgariaBurma/MyanmarCabo VerdeCambodiaCameroonCanadaCaribbeanCentral AmericaChileChinaCongoCosta RicaCroatiaCubaCzechoslovakiaDenmarkDominicaDominican RepublicEastern AfricaEastern AsiaEastern EuropeEcuadorEgyptEl SalvadorEnglandEritreaEthiopiaEuropeFijiFranceGermanyGhanaGreeceGrenadaGuatemalaGuyanaHaitiHondurasHong KongHungaryIndiaIndonesiaIranIraqIrelandIsraelItalyJamaicaJapanJordanKazakhstanKenyaKoreaKuwaitLaosLatin AmericaLatviaLebanonLiberiaLithuaniaMalaysiaMexicoMicronesiaMiddle AfricaMoldovaMoroccoNepalNetherlandsNicaraguaNigeriaNorth AmericaNorth MacedoniaNorthern AfricaNorthern EuropeNorwayOceaniaPakistanPanamaPeruPhilippinesPolandPortugalRomaniaRussiaSaudi ArabiaScotlandSenegalSerbiaSierra LeoneSingaporeSomaliaSouth AfricaSouth AmericaSouth Central AsiaSouth Eastern AsiaSouthern EuropeSpainSri LankaSt. Vincent and the GrenadinesSudanSwedenSwitzerlandSyriaTaiwanThailandTrinidad and TobagoTurkeyUgandaUkraineUruguayUzbekistanVenezuelaVietnamWest IndiesWestern AfricaWestern AsiaWestern EuropeYemenZaireZimbabweAzores
Disability Age 35 to 64
Income
Poverty
Unemployment
Labor Participation
Family Structure
Vehicle Availability
Education Level
Disability

Disability Age 35 to 64 Comparison

Immigrants from Colombia

Immigrants from Laos

Exceptional
Tragic
9.8%
DISABILITY AGE 35 TO 64
99.9/ 100
METRIC RATING
43rd/ 347
METRIC RANK
13.0%
DISABILITY AGE 35 TO 64
0.1/ 100
METRIC RATING
282nd/ 347
METRIC RANK

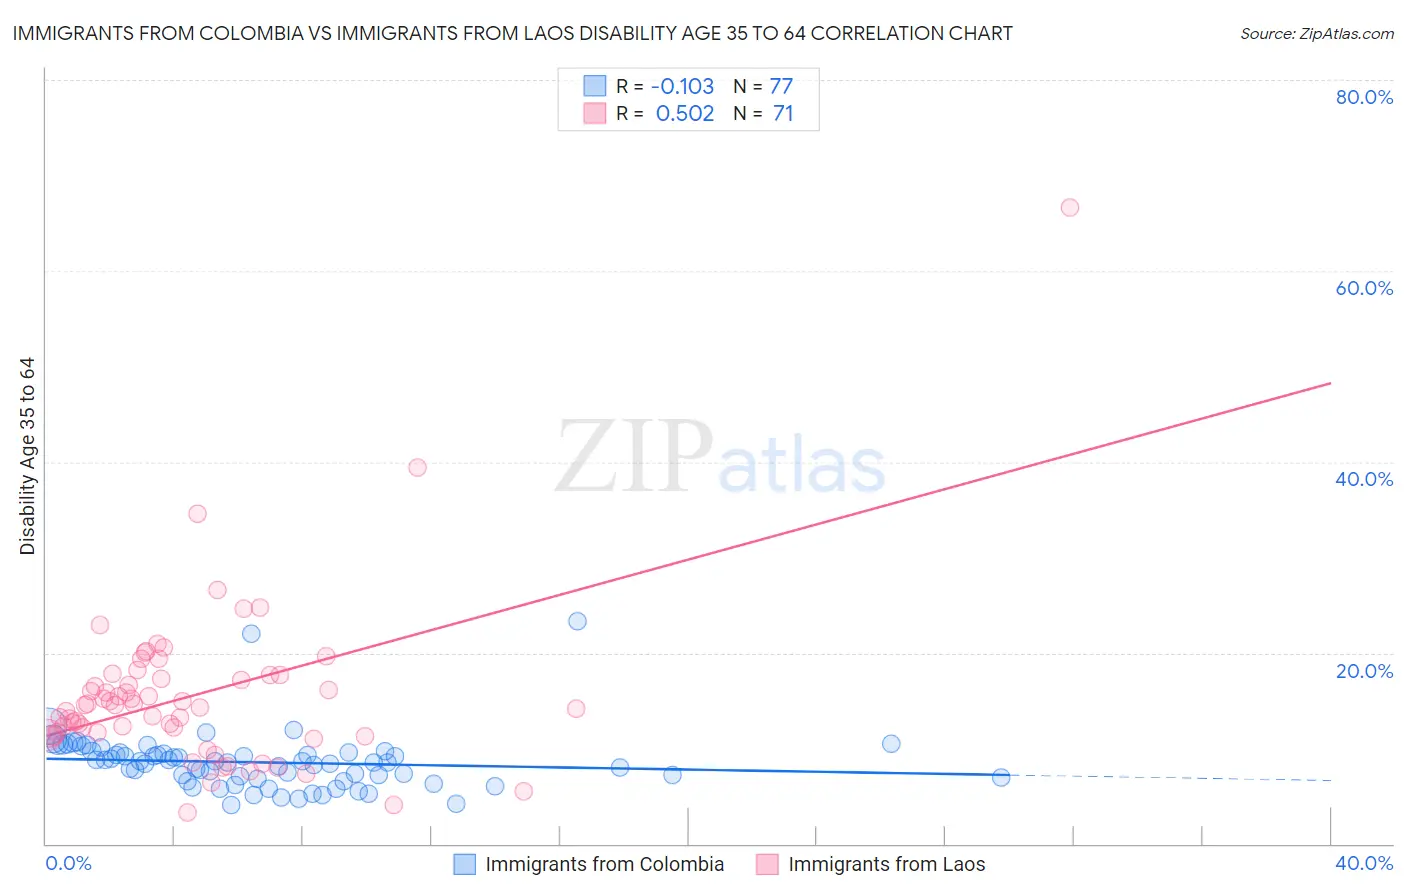
Immigrants from Colombia vs Immigrants from Laos Disability Age 35 to 64 Correlation Chart

The statistical analysis conducted on geographies consisting of 378,497,907 people shows a poor negative correlation between the proportion of Immigrants from Colombia and percentage of population with a disability between the ages 34 and 64 in the United States with a correlation coefficient (R) of -0.103 and weighted average of 9.8%. Similarly, the statistical analysis conducted on geographies consisting of 201,466,921 people shows a substantial positive correlation between the proportion of Immigrants from Laos and percentage of population with a disability between the ages 34 and 64 in the United States with a correlation coefficient (R) of 0.502 and weighted average of 13.0%, a difference of 32.9%.
Immigrants from Colombia vs Immigrants from Laos Disability Age 35 to 64

Disability Age 35 to 64 Correlation Summary

MeasurementImmigrants from ColombiaImmigrants from Laos
Minimum4.0%3.3%
Maximum23.3%66.7%
Range19.2%63.4%
Mean8.5%15.5%
Median8.5%14.5%
Interquartile 25% (IQ1)6.8%11.5%
Interquartile 75% (IQ3)9.6%17.6%
Interquartile Range (IQR)2.7%6.2%
Standard Deviation (Sample)3.0%8.6%
Standard Deviation (Population)3.0%8.6%

Similar Demographics by Disability Age 35 to 64

Demographics Similar to Immigrants from Colombia by Disability Age 35 to 64

In terms of disability age 35 to 64, the demographic groups most similar to Immigrants from Colombia are Immigrants from Malaysia (9.7%, a difference of 0.12%), Immigrants from Egypt (9.8%, a difference of 0.29%), Israeli (9.7%, a difference of 0.35%), Immigrants from Peru (9.8%, a difference of 0.35%), and Immigrants from Armenia (9.7%, a difference of 0.47%).
DemographicsRating | RankDisability Age 35 to 64
Immigrants | Cuba
99.9
/100
|
#36
Exceptional
9.7%
Immigrants | Turkey
99.9
/100
|
#37
Exceptional
9.7%
Egyptians
99.9
/100
|
#38
Exceptional
9.7%
Immigrants | Belarus
99.9
/100
|
#39
Exceptional
9.7%
Immigrants | Armenia
99.9
/100
|
#40
Exceptional
9.7%
Israelis
99.9
/100
|
#41
Exceptional
9.7%
Immigrants | Malaysia
99.9
/100
|
#42
Exceptional
9.7%
Immigrants | Colombia
99.9
/100
|
#43
Exceptional
9.8%
Immigrants | Egypt
99.9
/100
|
#44
Exceptional
9.8%
Immigrants | Peru
99.9
/100
|
#45
Exceptional
9.8%
Cambodians
99.8
/100
|
#46
Exceptional
9.8%
Immigrants | Belgium
99.8
/100
|
#47
Exceptional
9.8%
Immigrants | Serbia
99.8
/100
|
#48
Exceptional
9.8%
Immigrants | Greece
99.8
/100
|
#49
Exceptional
9.8%
Paraguayans
99.8
/100
|
#50
Exceptional
9.8%

Demographics Similar to Immigrants from Laos by Disability Age 35 to 64

In terms of disability age 35 to 64, the demographic groups most similar to Immigrants from Laos are Scotch-Irish (13.0%, a difference of 0.090%), Liberian (12.9%, a difference of 0.29%), Central American Indian (13.0%, a difference of 0.39%), Immigrants from Micronesia (12.9%, a difference of 0.46%), and French Canadian (12.9%, a difference of 0.48%).
DemographicsRating | RankDisability Age 35 to 64
Dominicans
0.1
/100
|
#275
Tragic
12.9%
Somalis
0.1
/100
|
#276
Tragic
12.9%
Immigrants | Dominican Republic
0.1
/100
|
#277
Tragic
12.9%
French Canadians
0.1
/100
|
#278
Tragic
12.9%
Immigrants | Micronesia
0.1
/100
|
#279
Tragic
12.9%
Liberians
0.1
/100
|
#280
Tragic
12.9%
Scotch-Irish
0.1
/100
|
#281
Tragic
13.0%
Immigrants | Laos
0.1
/100
|
#282
Tragic
13.0%
Central American Indians
0.0
/100
|
#283
Tragic
13.0%
Immigrants | Nonimmigrants
0.0
/100
|
#284
Tragic
13.0%
Immigrants | Somalia
0.0
/100
|
#285
Tragic
13.1%
Hmong
0.0
/100
|
#286
Tragic
13.1%
Tlingit-Haida
0.0
/100
|
#287
Tragic
13.2%
Fijians
0.0
/100
|
#288
Tragic
13.2%
Indonesians
0.0
/100
|
#289
Tragic
13.2%