Immigrants from China vs Immigrants from Dominica In Labor Force | Age 16-19
COMPARE
Immigrants from China
Immigrants from Dominica
In Labor Force | Age 16-19
In Labor Force | Age 16-19 Comparison
Immigrants from China
Immigrants from Dominica
31.1%
IN LABOR FORCE | AGE 16-19
0.0/ 100
METRIC RATING
325th/ 347
METRIC RANK
32.5%
IN LABOR FORCE | AGE 16-19
0.0/ 100
METRIC RATING
303rd/ 347
METRIC RANK
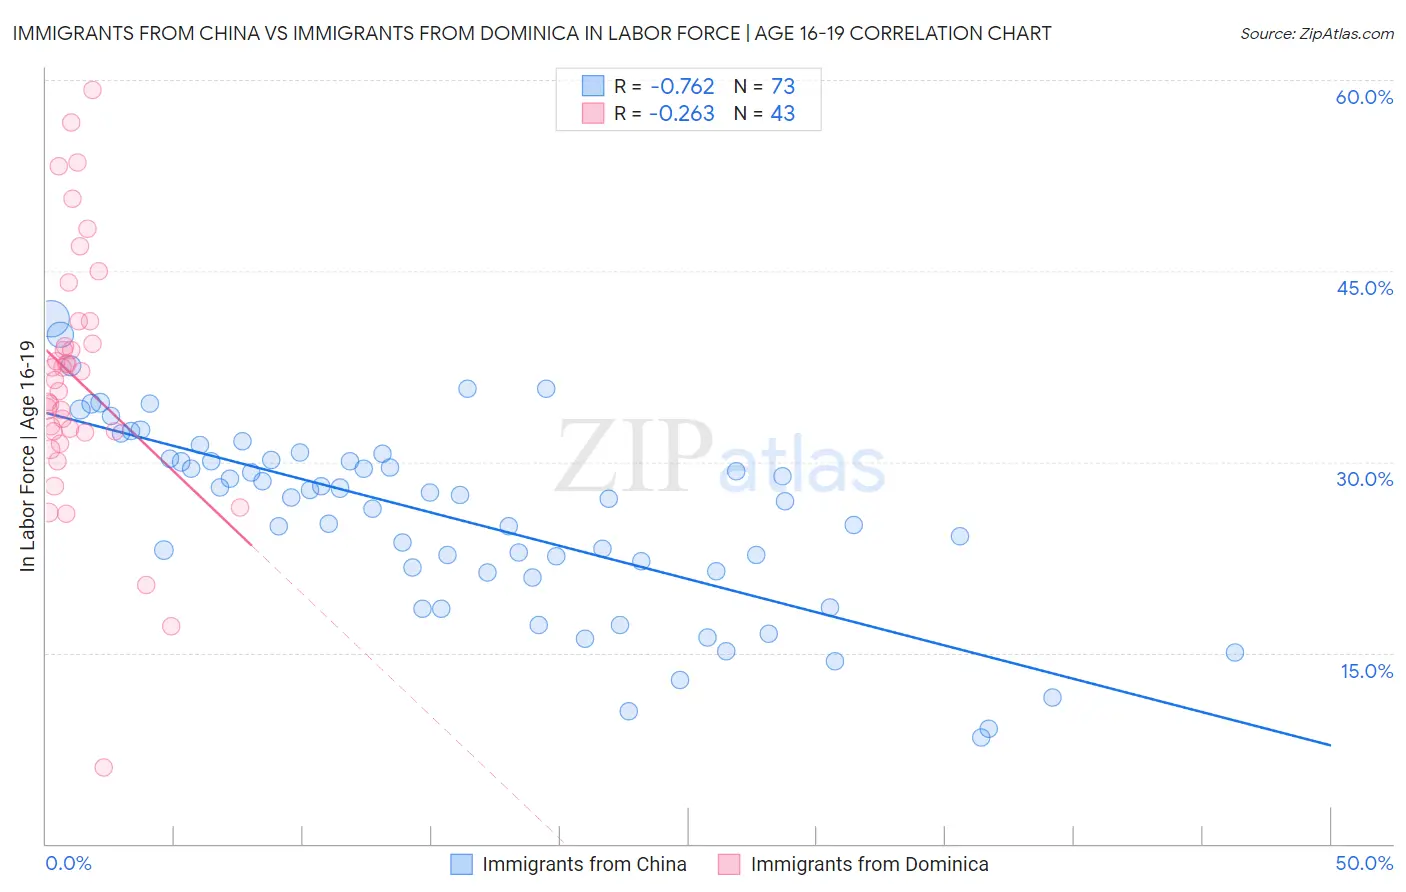
Immigrants from China vs Immigrants from Dominica In Labor Force | Age 16-19 Correlation Chart
The statistical analysis conducted on geographies consisting of 456,166,794 people shows a strong negative correlation between the proportion of Immigrants from China and labor force participation rate among population between the ages 16 and 19 in the United States with a correlation coefficient (R) of -0.762 and weighted average of 31.1%. Similarly, the statistical analysis conducted on geographies consisting of 83,778,469 people shows a weak negative correlation between the proportion of Immigrants from Dominica and labor force participation rate among population between the ages 16 and 19 in the United States with a correlation coefficient (R) of -0.263 and weighted average of 32.5%, a difference of 4.3%.
In Labor Force | Age 16-19 Correlation Summary
| Measurement | Immigrants from China | Immigrants from Dominica |
| Minimum | 8.3% | 6.0% |
| Maximum | 41.3% | 59.2% |
| Range | 33.0% | 53.2% |
| Mean | 25.6% | 36.5% |
| Median | 27.2% | 36.5% |
| Interquartile 25% (IQ1) | 21.3% | 32.3% |
| Interquartile 75% (IQ3) | 30.2% | 41.0% |
| Interquartile Range (IQR) | 8.8% | 8.7% |
| Standard Deviation (Sample) | 7.3% | 10.1% |
| Standard Deviation (Population) | 7.3% | 10.0% |
Similar Demographics by In Labor Force | Age 16-19
Demographics Similar to Immigrants from China by In Labor Force | Age 16-19
In terms of in labor force | age 16-19, the demographic groups most similar to Immigrants from China are Dominican (31.2%, a difference of 0.15%), Immigrants from Dominican Republic (31.1%, a difference of 0.20%), Immigrants from Caribbean (31.2%, a difference of 0.33%), Immigrants from Taiwan (31.0%, a difference of 0.36%), and Immigrants from Ecuador (31.0%, a difference of 0.40%).
| Demographics | Rating | Rank | In Labor Force | Age 16-19 |
| Immigrants | Yemen | 0.0 /100 | #318 | Tragic 31.5% |
| Soviet Union | 0.0 /100 | #319 | Tragic 31.4% |
| Ecuadorians | 0.0 /100 | #320 | Tragic 31.4% |
| West Indians | 0.0 /100 | #321 | Tragic 31.3% |
| Tohono O'odham | 0.0 /100 | #322 | Tragic 31.3% |
| Immigrants | Caribbean | 0.0 /100 | #323 | Tragic 31.2% |
| Dominicans | 0.0 /100 | #324 | Tragic 31.2% |
| Immigrants | China | 0.0 /100 | #325 | Tragic 31.1% |
| Immigrants | Dominican Republic | 0.0 /100 | #326 | Tragic 31.1% |
| Immigrants | Taiwan | 0.0 /100 | #327 | Tragic 31.0% |
| Immigrants | Ecuador | 0.0 /100 | #328 | Tragic 31.0% |
| Barbadians | 0.0 /100 | #329 | Tragic 31.0% |
| Lumbee | 0.0 /100 | #330 | Tragic 31.0% |
| Trinidadians and Tobagonians | 0.0 /100 | #331 | Tragic 30.9% |
| Immigrants | Israel | 0.0 /100 | #332 | Tragic 30.5% |
Demographics Similar to Immigrants from Dominica by In Labor Force | Age 16-19
In terms of in labor force | age 16-19, the demographic groups most similar to Immigrants from Dominica are Israeli (32.4%, a difference of 0.19%), Nicaraguan (32.4%, a difference of 0.24%), Spanish American Indian (32.4%, a difference of 0.37%), Immigrants from Jamaica (32.2%, a difference of 0.86%), and Belizean (32.8%, a difference of 0.90%).
| Demographics | Rating | Rank | In Labor Force | Age 16-19 |
| Jamaicans | 0.1 /100 | #296 | Tragic 33.2% |
| Immigrants | Haiti | 0.1 /100 | #297 | Tragic 33.2% |
| Iranians | 0.0 /100 | #298 | Tragic 33.0% |
| Armenians | 0.0 /100 | #299 | Tragic 32.9% |
| Immigrants | Argentina | 0.0 /100 | #300 | Tragic 32.9% |
| Okinawans | 0.0 /100 | #301 | Tragic 32.8% |
| Belizeans | 0.0 /100 | #302 | Tragic 32.8% |
| Immigrants | Dominica | 0.0 /100 | #303 | Tragic 32.5% |
| Israelis | 0.0 /100 | #304 | Tragic 32.4% |
| Nicaraguans | 0.0 /100 | #305 | Tragic 32.4% |
| Spanish American Indians | 0.0 /100 | #306 | Tragic 32.4% |
| Immigrants | Jamaica | 0.0 /100 | #307 | Tragic 32.2% |
| Navajo | 0.0 /100 | #308 | Tragic 32.1% |
| Immigrants | Eastern Asia | 0.0 /100 | #309 | Tragic 32.0% |
| Immigrants | Iran | 0.0 /100 | #310 | Tragic 32.0% |