Immigrants from China vs Immigrants from Armenia In Labor Force | Age 16-19
COMPARE
Immigrants from China
Immigrants from Armenia
In Labor Force | Age 16-19
In Labor Force | Age 16-19 Comparison
Immigrants from China
Immigrants from Armenia
31.1%
IN LABOR FORCE | AGE 16-19
0.0/ 100
METRIC RATING
325th/ 347
METRIC RANK
29.0%
IN LABOR FORCE | AGE 16-19
0.0/ 100
METRIC RATING
341st/ 347
METRIC RANK
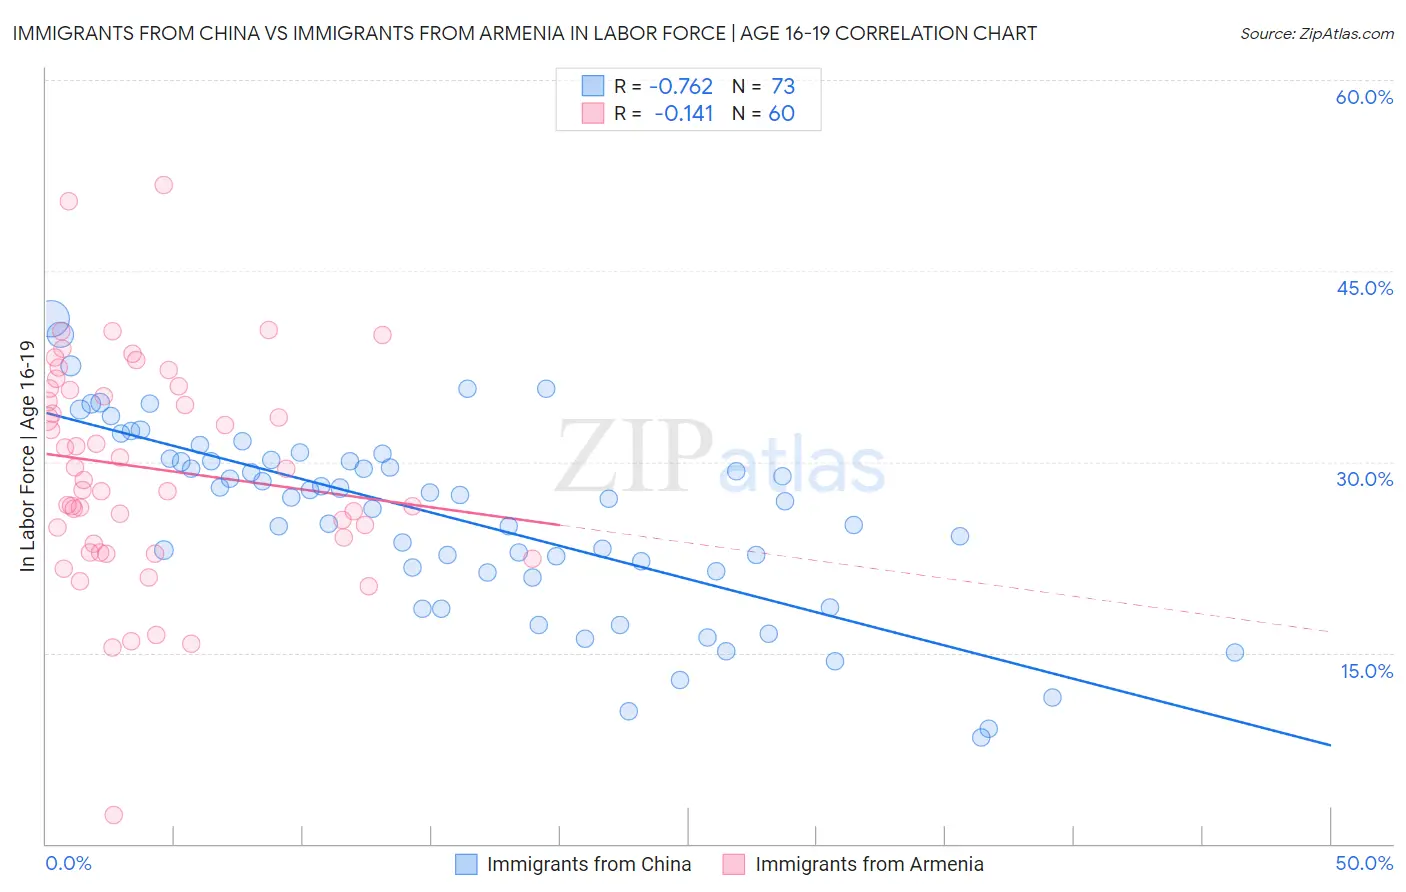
Immigrants from China vs Immigrants from Armenia In Labor Force | Age 16-19 Correlation Chart
The statistical analysis conducted on geographies consisting of 456,166,794 people shows a strong negative correlation between the proportion of Immigrants from China and labor force participation rate among population between the ages 16 and 19 in the United States with a correlation coefficient (R) of -0.762 and weighted average of 31.1%. Similarly, the statistical analysis conducted on geographies consisting of 97,663,503 people shows a poor negative correlation between the proportion of Immigrants from Armenia and labor force participation rate among population between the ages 16 and 19 in the United States with a correlation coefficient (R) of -0.141 and weighted average of 29.0%, a difference of 7.3%.
In Labor Force | Age 16-19 Correlation Summary
| Measurement | Immigrants from China | Immigrants from Armenia |
| Minimum | 8.3% | 2.3% |
| Maximum | 41.3% | 51.8% |
| Range | 33.0% | 49.5% |
| Mean | 25.6% | 29.5% |
| Median | 27.2% | 29.1% |
| Interquartile 25% (IQ1) | 21.3% | 23.9% |
| Interquartile 75% (IQ3) | 30.2% | 35.7% |
| Interquartile Range (IQR) | 8.8% | 11.9% |
| Standard Deviation (Sample) | 7.3% | 8.6% |
| Standard Deviation (Population) | 7.3% | 8.6% |
Demographics Similar to Immigrants from China and Immigrants from Armenia by In Labor Force | Age 16-19
In terms of in labor force | age 16-19, the demographic groups most similar to Immigrants from China are Dominican (31.2%, a difference of 0.15%), Immigrants from Dominican Republic (31.1%, a difference of 0.20%), Immigrants from Caribbean (31.2%, a difference of 0.33%), Immigrants from Taiwan (31.0%, a difference of 0.36%), and Immigrants from Ecuador (31.0%, a difference of 0.40%). Similarly, the demographic groups most similar to Immigrants from Armenia are Immigrants from Barbados (29.0%, a difference of 0.15%), British West Indian (29.1%, a difference of 0.23%), Immigrants from Uzbekistan (29.2%, a difference of 0.43%), Vietnamese (29.6%, a difference of 1.8%), and Immigrants from Bangladesh (30.0%, a difference of 3.5%).
| Demographics | Rating | Rank | In Labor Force | Age 16-19 |
| Immigrants | Caribbean | 0.0 /100 | #323 | Tragic 31.2% |
| Dominicans | 0.0 /100 | #324 | Tragic 31.2% |
| Immigrants | China | 0.0 /100 | #325 | Tragic 31.1% |
| Immigrants | Dominican Republic | 0.0 /100 | #326 | Tragic 31.1% |
| Immigrants | Taiwan | 0.0 /100 | #327 | Tragic 31.0% |
| Immigrants | Ecuador | 0.0 /100 | #328 | Tragic 31.0% |
| Barbadians | 0.0 /100 | #329 | Tragic 31.0% |
| Lumbee | 0.0 /100 | #330 | Tragic 31.0% |
| Trinidadians and Tobagonians | 0.0 /100 | #331 | Tragic 30.9% |
| Immigrants | Israel | 0.0 /100 | #332 | Tragic 30.5% |
| Immigrants | Hong Kong | 0.0 /100 | #333 | Tragic 30.5% |
| Puerto Ricans | 0.0 /100 | #334 | Tragic 30.3% |
| Immigrants | Cuba | 0.0 /100 | #335 | Tragic 30.2% |
| Immigrants | Trinidad and Tobago | 0.0 /100 | #336 | Tragic 30.2% |
| Immigrants | Bangladesh | 0.0 /100 | #337 | Tragic 30.0% |
| Vietnamese | 0.0 /100 | #338 | Tragic 29.6% |
| Immigrants | Uzbekistan | 0.0 /100 | #339 | Tragic 29.2% |
| British West Indians | 0.0 /100 | #340 | Tragic 29.1% |
| Immigrants | Armenia | 0.0 /100 | #341 | Tragic 29.0% |
| Immigrants | Barbados | 0.0 /100 | #342 | Tragic 29.0% |
| Yuman | 0.0 /100 | #343 | Tragic 27.7% |