Immigrants from China vs Immigrants from Albania In Labor Force | Age 20-64
COMPARE
Immigrants from China
Immigrants from Albania
In Labor Force | Age 20-64
In Labor Force | Age 20-64 Comparison
Immigrants from China
Immigrants from Albania
79.7%
IN LABOR FORCE | AGE 20-64
69.1/ 100
METRIC RATING
157th/ 347
METRIC RANK
80.3%
IN LABOR FORCE | AGE 20-64
98.7/ 100
METRIC RATING
64th/ 347
METRIC RANK
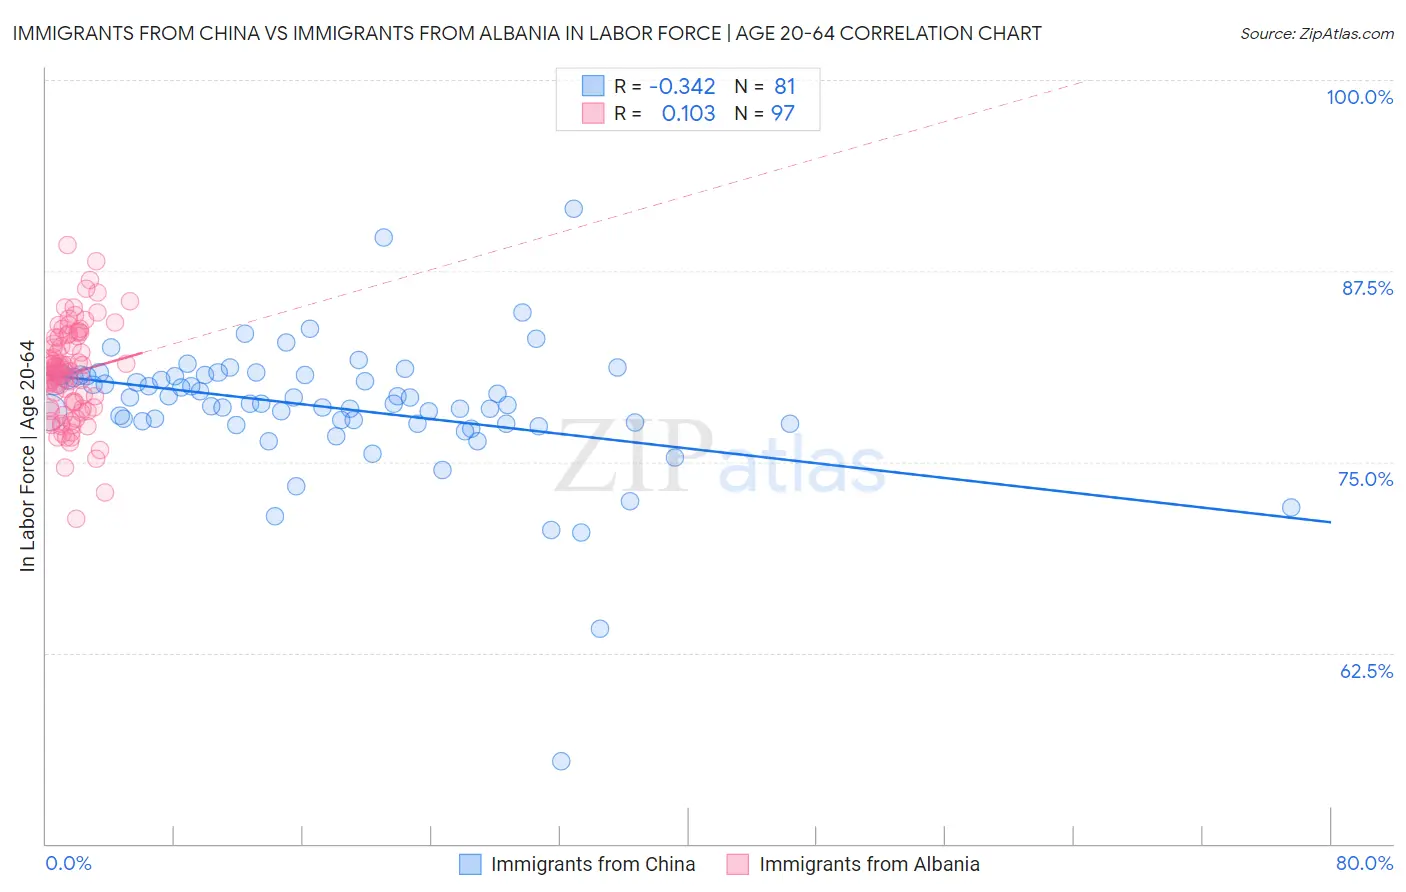
Immigrants from China vs Immigrants from Albania In Labor Force | Age 20-64 Correlation Chart
The statistical analysis conducted on geographies consisting of 457,119,637 people shows a mild negative correlation between the proportion of Immigrants from China and labor force participation rate among population between the ages 20 and 64 in the United States with a correlation coefficient (R) of -0.342 and weighted average of 79.7%. Similarly, the statistical analysis conducted on geographies consisting of 119,398,682 people shows a poor positive correlation between the proportion of Immigrants from Albania and labor force participation rate among population between the ages 20 and 64 in the United States with a correlation coefficient (R) of 0.103 and weighted average of 80.3%, a difference of 0.71%.
In Labor Force | Age 20-64 Correlation Summary
| Measurement | Immigrants from China | Immigrants from Albania |
| Minimum | 55.4% | 71.3% |
| Maximum | 91.6% | 89.2% |
| Range | 36.2% | 17.9% |
| Mean | 78.6% | 80.8% |
| Median | 78.8% | 80.9% |
| Interquartile 25% (IQ1) | 77.5% | 78.5% |
| Interquartile 75% (IQ3) | 80.7% | 83.1% |
| Interquartile Range (IQR) | 3.2% | 4.6% |
| Standard Deviation (Sample) | 4.5% | 3.2% |
| Standard Deviation (Population) | 4.5% | 3.1% |
Similar Demographics by In Labor Force | Age 20-64
Demographics Similar to Immigrants from China by In Labor Force | Age 20-64
In terms of in labor force | age 20-64, the demographic groups most similar to Immigrants from China are Immigrants from Kazakhstan (79.7%, a difference of 0.0%), New Zealander (79.7%, a difference of 0.0%), Immigrants from South Africa (79.7%, a difference of 0.0%), Senegalese (79.7%, a difference of 0.0%), and Austrian (79.7%, a difference of 0.010%).
| Demographics | Rating | Rank | In Labor Force | Age 20-64 |
| Costa Ricans | 72.4 /100 | #150 | Good 79.7% |
| Scandinavians | 72.0 /100 | #151 | Good 79.7% |
| Immigrants | Northern Europe | 72.0 /100 | #152 | Good 79.7% |
| Immigrants | Kazakhstan | 69.5 /100 | #153 | Good 79.7% |
| New Zealanders | 69.4 /100 | #154 | Good 79.7% |
| Immigrants | South Africa | 69.2 /100 | #155 | Good 79.7% |
| Senegalese | 69.1 /100 | #156 | Good 79.7% |
| Immigrants | China | 69.1 /100 | #157 | Good 79.7% |
| Austrians | 67.6 /100 | #158 | Good 79.7% |
| Immigrants | Cuba | 66.7 /100 | #159 | Good 79.7% |
| Moroccans | 66.7 /100 | #160 | Good 79.7% |
| South Africans | 66.2 /100 | #161 | Good 79.7% |
| Germans | 65.2 /100 | #162 | Good 79.7% |
| Immigrants | Costa Rica | 64.6 /100 | #163 | Good 79.7% |
| Immigrants | Burma/Myanmar | 64.4 /100 | #164 | Good 79.7% |
Demographics Similar to Immigrants from Albania by In Labor Force | Age 20-64
In terms of in labor force | age 20-64, the demographic groups most similar to Immigrants from Albania are Immigrants from Korea (80.3%, a difference of 0.0%), Carpatho Rusyn (80.3%, a difference of 0.010%), Lithuanian (80.2%, a difference of 0.010%), Macedonian (80.2%, a difference of 0.010%), and Taiwanese (80.2%, a difference of 0.010%).
| Demographics | Rating | Rank | In Labor Force | Age 20-64 |
| Afghans | 98.9 /100 | #57 | Exceptional 80.3% |
| Serbians | 98.9 /100 | #58 | Exceptional 80.3% |
| Swedes | 98.9 /100 | #59 | Exceptional 80.3% |
| Tongans | 98.8 /100 | #60 | Exceptional 80.3% |
| Burmese | 98.8 /100 | #61 | Exceptional 80.3% |
| Carpatho Rusyns | 98.8 /100 | #62 | Exceptional 80.3% |
| Immigrants | Korea | 98.8 /100 | #63 | Exceptional 80.3% |
| Immigrants | Albania | 98.7 /100 | #64 | Exceptional 80.3% |
| Lithuanians | 98.7 /100 | #65 | Exceptional 80.2% |
| Macedonians | 98.7 /100 | #66 | Exceptional 80.2% |
| Taiwanese | 98.6 /100 | #67 | Exceptional 80.2% |
| Bhutanese | 98.6 /100 | #68 | Exceptional 80.2% |
| Albanians | 98.6 /100 | #69 | Exceptional 80.2% |
| Immigrants | Turkey | 98.5 /100 | #70 | Exceptional 80.2% |
| Soviet Union | 98.5 /100 | #71 | Exceptional 80.2% |