Immigrants from China vs Immigrants from Sweden In Labor Force | Age 20-24
COMPARE
Immigrants from China
Immigrants from Sweden
In Labor Force | Age 20-24
In Labor Force | Age 20-24 Comparison
Immigrants from China
Immigrants from Sweden
71.1%
IN LABOR FORCE | AGE 20-24
0.0/ 100
METRIC RATING
328th/ 347
METRIC RANK
74.2%
IN LABOR FORCE | AGE 20-24
4.6/ 100
METRIC RATING
229th/ 347
METRIC RANK
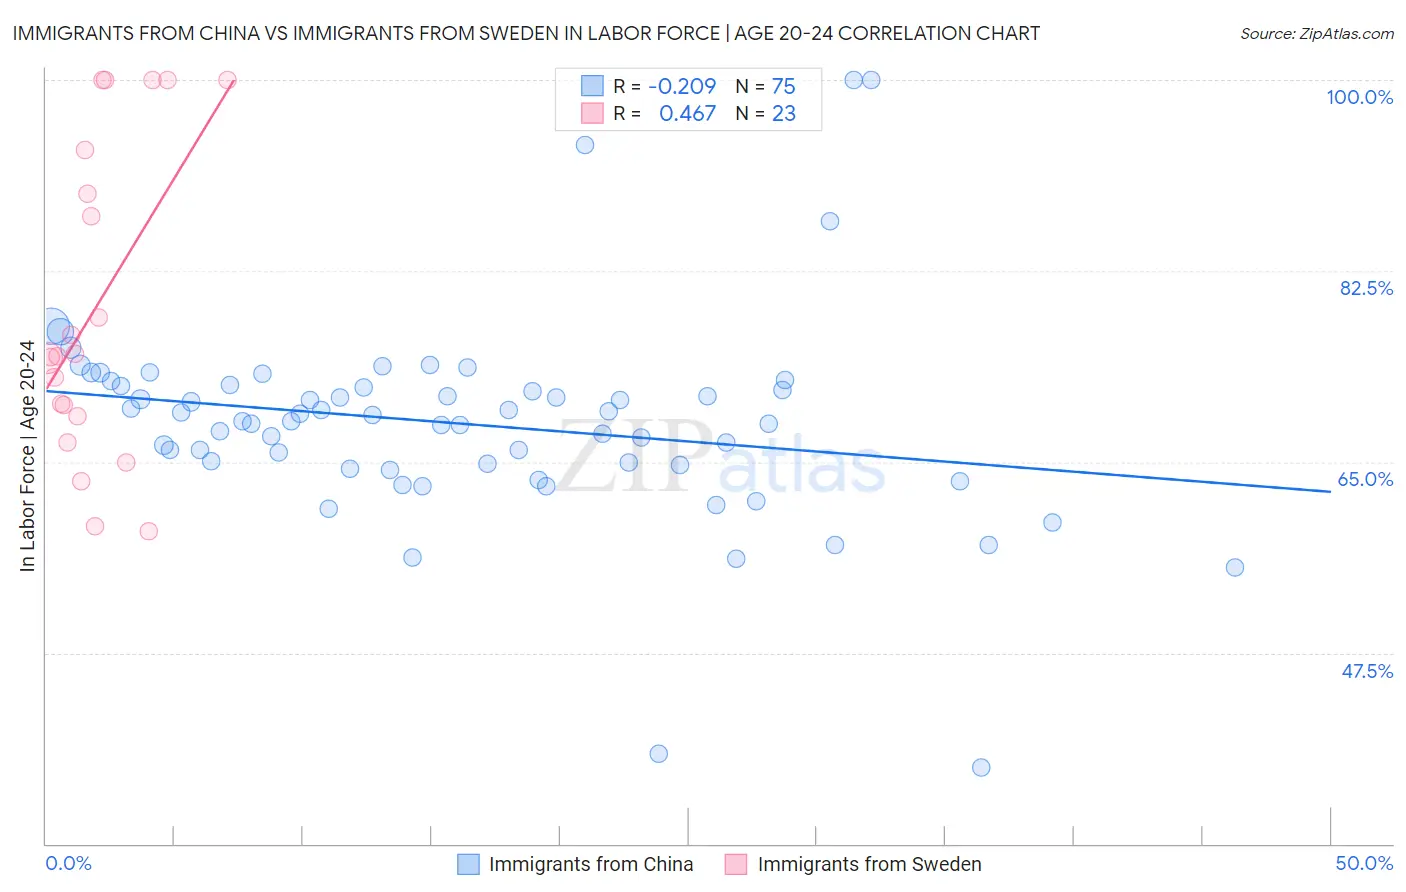
Immigrants from China vs Immigrants from Sweden In Labor Force | Age 20-24 Correlation Chart
The statistical analysis conducted on geographies consisting of 456,875,563 people shows a weak negative correlation between the proportion of Immigrants from China and labor force participation rate among population between the ages 20 and 24 in the United States with a correlation coefficient (R) of -0.209 and weighted average of 71.1%. Similarly, the statistical analysis conducted on geographies consisting of 164,691,562 people shows a moderate positive correlation between the proportion of Immigrants from Sweden and labor force participation rate among population between the ages 20 and 24 in the United States with a correlation coefficient (R) of 0.467 and weighted average of 74.2%, a difference of 4.4%.
In Labor Force | Age 20-24 Correlation Summary
| Measurement | Immigrants from China | Immigrants from Sweden |
| Minimum | 37.0% | 58.6% |
| Maximum | 100.0% | 100.0% |
| Range | 63.0% | 41.4% |
| Mean | 68.5% | 79.1% |
| Median | 68.8% | 74.7% |
| Interquartile 25% (IQ1) | 64.7% | 69.2% |
| Interquartile 75% (IQ3) | 71.9% | 93.6% |
| Interquartile Range (IQR) | 7.3% | 24.4% |
| Standard Deviation (Sample) | 9.5% | 14.1% |
| Standard Deviation (Population) | 9.4% | 13.8% |
Similar Demographics by In Labor Force | Age 20-24
Demographics Similar to Immigrants from China by In Labor Force | Age 20-24
In terms of in labor force | age 20-24, the demographic groups most similar to Immigrants from China are Dominican (71.1%, a difference of 0.020%), Immigrants from Trinidad and Tobago (71.1%, a difference of 0.020%), Barbadian (71.1%, a difference of 0.10%), Immigrants from Dominican Republic (71.2%, a difference of 0.21%), and Yup'ik (70.9%, a difference of 0.24%).
| Demographics | Rating | Rank | In Labor Force | Age 20-24 |
| Immigrants | Taiwan | 0.0 /100 | #321 | Tragic 71.5% |
| Filipinos | 0.0 /100 | #322 | Tragic 71.4% |
| West Indians | 0.0 /100 | #323 | Tragic 71.3% |
| Immigrants | Dominican Republic | 0.0 /100 | #324 | Tragic 71.2% |
| Barbadians | 0.0 /100 | #325 | Tragic 71.1% |
| Dominicans | 0.0 /100 | #326 | Tragic 71.1% |
| Immigrants | Trinidad and Tobago | 0.0 /100 | #327 | Tragic 71.1% |
| Immigrants | China | 0.0 /100 | #328 | Tragic 71.1% |
| Yup'ik | 0.0 /100 | #329 | Tragic 70.9% |
| Vietnamese | 0.0 /100 | #330 | Tragic 70.6% |
| Immigrants | Bangladesh | 0.0 /100 | #331 | Tragic 70.6% |
| Immigrants | Uzbekistan | 0.0 /100 | #332 | Tragic 70.4% |
| Yuman | 0.0 /100 | #333 | Tragic 70.3% |
| British West Indians | 0.0 /100 | #334 | Tragic 70.0% |
| Immigrants | Barbados | 0.0 /100 | #335 | Tragic 69.7% |
Demographics Similar to Immigrants from Sweden by In Labor Force | Age 20-24
In terms of in labor force | age 20-24, the demographic groups most similar to Immigrants from Sweden are Immigrants from Albania (74.2%, a difference of 0.030%), Immigrants from Ukraine (74.2%, a difference of 0.040%), Immigrants from Greece (74.2%, a difference of 0.040%), Immigrants from Switzerland (74.2%, a difference of 0.050%), and Immigrants from Fiji (74.3%, a difference of 0.090%).
| Demographics | Rating | Rank | In Labor Force | Age 20-24 |
| Immigrants | India | 9.9 /100 | #222 | Tragic 74.4% |
| Hispanics or Latinos | 7.9 /100 | #223 | Tragic 74.4% |
| Seminole | 6.9 /100 | #224 | Tragic 74.3% |
| Ghanaians | 6.2 /100 | #225 | Tragic 74.3% |
| Immigrants | Fiji | 5.9 /100 | #226 | Tragic 74.3% |
| Immigrants | Ireland | 5.8 /100 | #227 | Tragic 74.3% |
| Immigrants | Ukraine | 5.1 /100 | #228 | Tragic 74.2% |
| Immigrants | Sweden | 4.6 /100 | #229 | Tragic 74.2% |
| Immigrants | Albania | 4.3 /100 | #230 | Tragic 74.2% |
| Immigrants | Greece | 4.1 /100 | #231 | Tragic 74.2% |
| Immigrants | Switzerland | 4.1 /100 | #232 | Tragic 74.2% |
| Immigrants | Chile | 3.7 /100 | #233 | Tragic 74.1% |
| Immigrants | Immigrants | 3.6 /100 | #234 | Tragic 74.1% |
| Laotians | 3.5 /100 | #235 | Tragic 74.1% |
| Immigrants | France | 3.3 /100 | #236 | Tragic 74.1% |